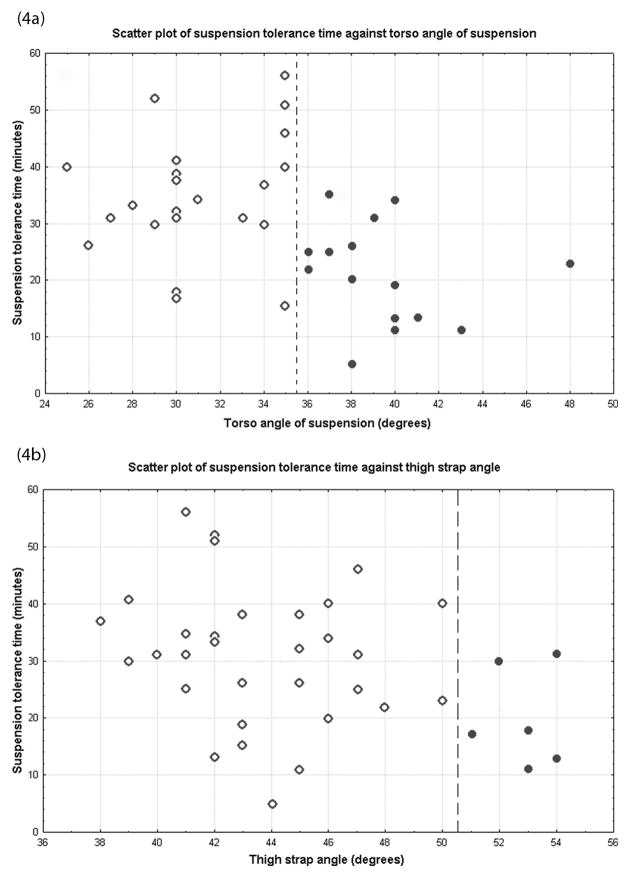
Figure 4.
In 4a, the dashed line indicates a natural point, about 35°, where the data set forms two obvious clusters (i.e., ≤35° and >35° of torso angles of suspension). There is no clear cut point of torso angle of suspension between 25° and 35° at which the suspension tolerance time is clearly dropping. For the angles of suspension greater than 35°, the corresponding suspension tolerance time drops substantially in proportion to the torso angle of suspension. When the two clusters of data are combined, suspension angle still has a correlation with suspension tolerance time (r = −.43, p = .008). In 4b, thigh strap angle has a correlation with suspension tolerance time (r = −.36, p = .03). The dashed line indicates a natural point, about 50°, above which the suspension tolerance time is significantly less than that of the ≤50° cluster.

