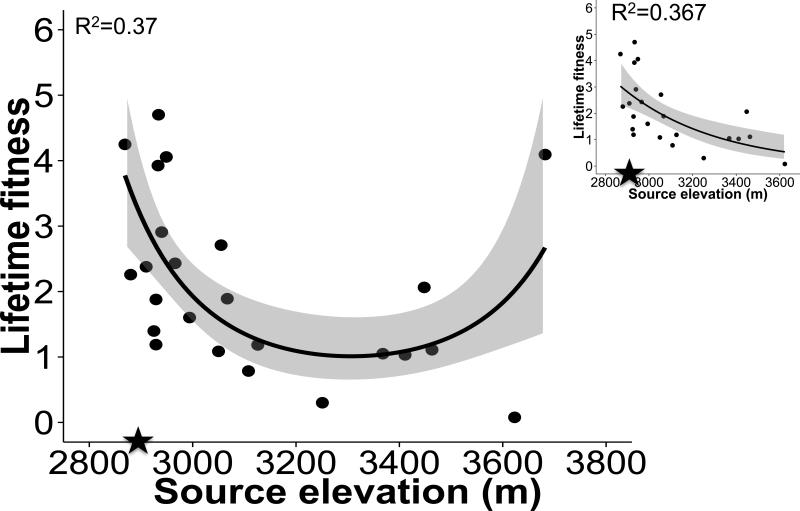
Figure 4.
In the CO low elevation garden (2011 cohort), lifetime fitness varied with linear and quadratic effects of source elevation. The elevation of the garden (2891m) is indicated by a closed star on the X-axis. Fitness declined to a minimum for genotypes from mid-elevation populations and then increased to an unexpected peak in genotypes from high source elevation. The highest elevation family (3682m) is an influential outlier; when removed (small panel) fitness declines with source elevation, as expected. These results suggest local maladaptation, with a foreign high elevation family achieving or exceeding fitness levels of the lowest elevation families. Shading around predicted regression lines indicates 95% Confidence Intervals.

