
Figure 4.
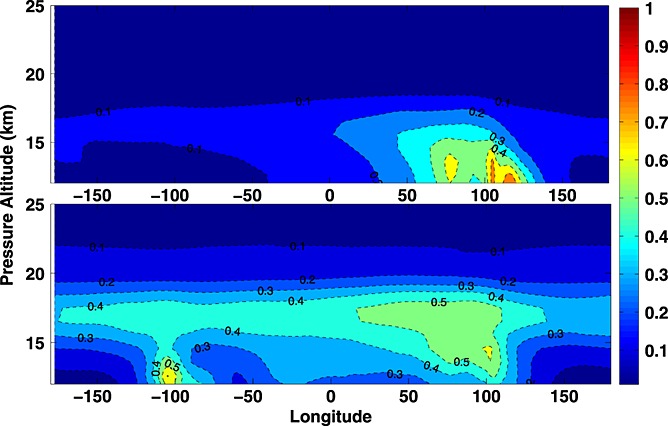
(top) POA and (bottom) SOA mass mixing ratios (ppb) simulated by CESM1/CARMA in the ATAL during the JJA season. Contour interval is 0.1 ppb.
Official websites use .gov
A
.gov website belongs to an official
government organization in the United States.
Secure .gov websites use HTTPS
A lock (
) or https:// means you've safely
connected to the .gov website. Share sensitive
information only on official, secure websites.
(top) POA and (bottom) SOA mass mixing ratios (ppb) simulated by CESM1/CARMA in the ATAL during the JJA season. Contour interval is 0.1 ppb.