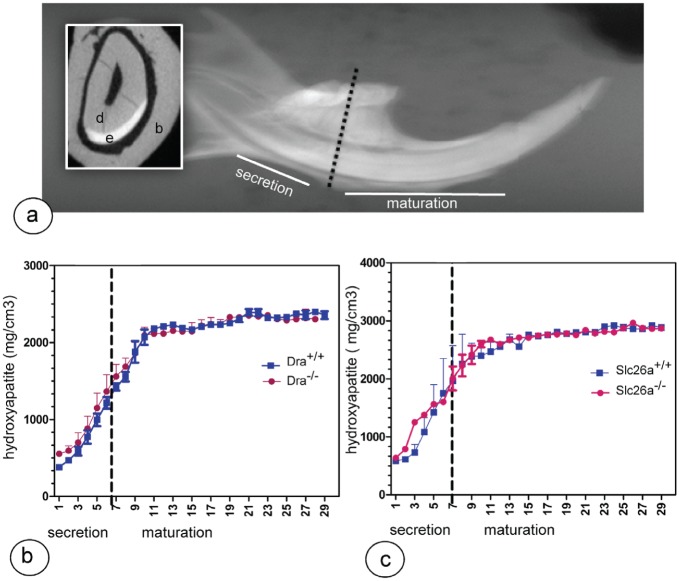
Figure 3.
The mineral density of lower incisor enamel. (a) Broken line indicates the reference line between first and second molars indicating the approximate transition from secretory stage to maturation stage (inset: cross section; b, bone; d, dentin; e, enamel) from a wild-type mouse. (b, c) Dra- and Slc26a6-null mutant mice show mineral density measurements plotted against slice numbers (representing progressive stages of enamel formation with 500-μm intervals). The mineral content of both null mutant mice (red) is not different from that of wild-type littermate controls (blue). This figure is available in color online at http://jdr.sagepub.com.

