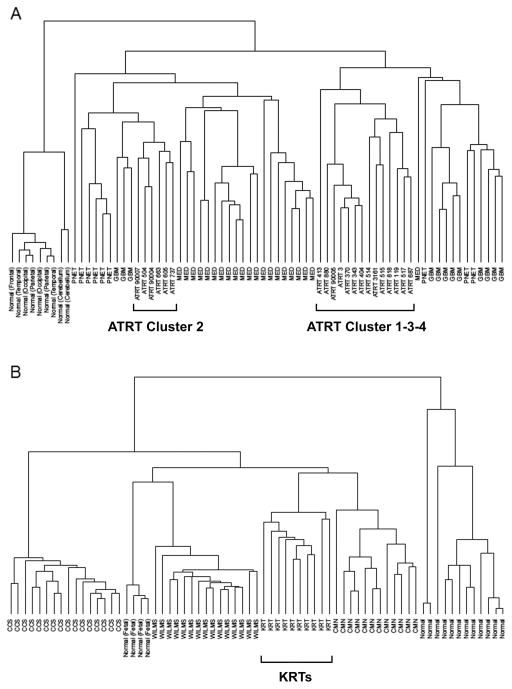
Fig 1.
Unsupervised hierarchical clustering results. A: Using 20 AT/RTs, 42 other pediatric high-grade brain tumors, and 9 pediatric non-tumor brain samples, genes with the top 25% variance, average linkage and spearman distances. B: Using 10 kidney rhabdoid tumors, 43 other kidney tumors, and 16 normal kidney samples, genes with the top 25% variance, average linkage and Spearman distances.

