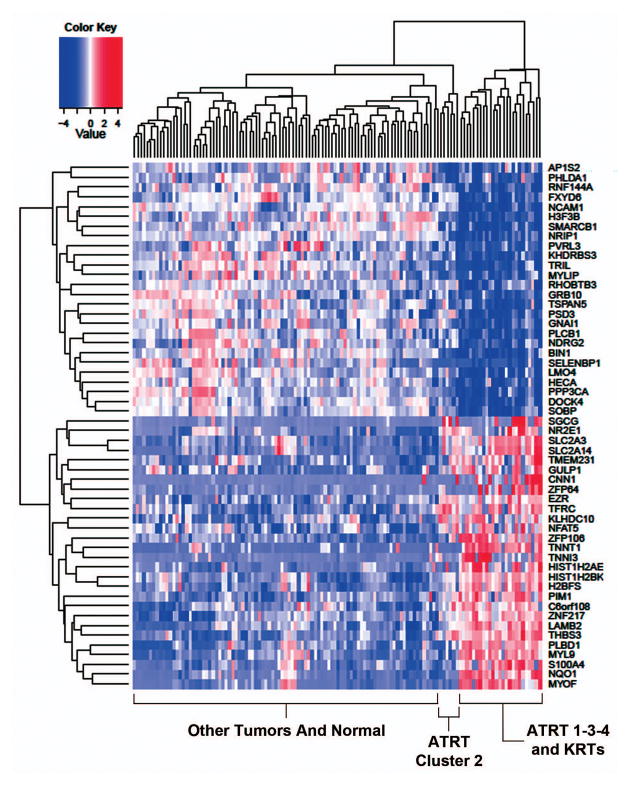
Fig 3.
Heatmap of genes dysregulated in both AT/RTs and KRTs, compared to other tumors. The expression of dysregulated genes common to both AT/RTs (n=20) and KRTs (n=10) compared to other brain and kidney tumors, respectively, is shown. Normal samples are also included on the heatmap for comparison.

