Figure 2.
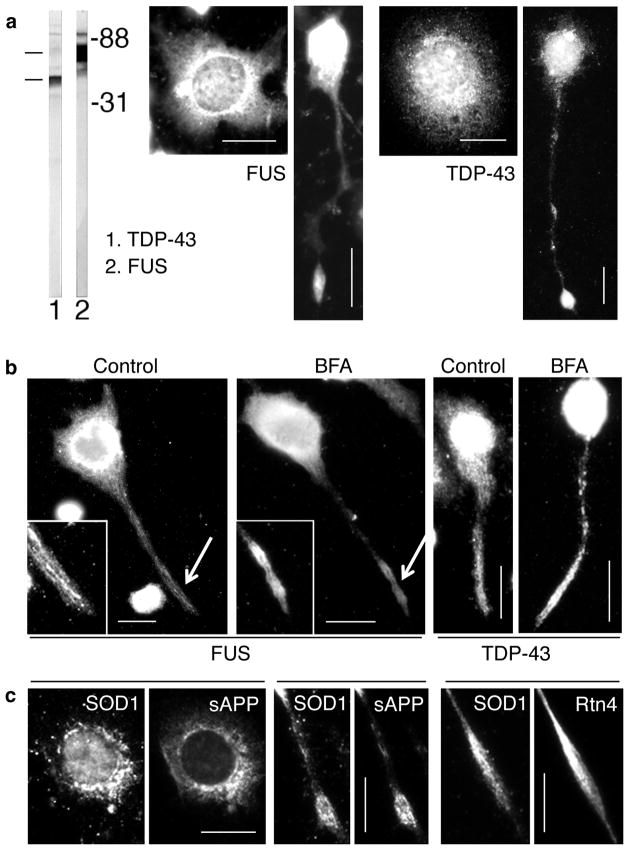
The distribution patterns of FUS, TDP-43, and SOD1 are similar to those of sAPP, and the tubular ER (Rtn4), both in the soma and the neurites, in CAD cells (see also supplementary fig. 1). (a) Localization to a broad region in the soma, and accumulation at neurite terminals, of FUS and TDP-43. In cells with flat appearance, the distribution is typical for the ER. The immunoblot shows FUS and TDP-43 in CAD cell extract. Molecular weight markers are given in kilodaltons. (b) BFA treatment does not affect the localization of FUS and TDP-43 to elongated structures at neurite terminals. The insets show higher magnifications of the terminals (arrows), at increased contrast and brightness. (c) Colocalization, to the same intracellular structure, of SOD1 with sAPP and Rtn4, in the soma and at neurite terminals. We note that conventional immunofluorescence microscopy - as used here - does not resolve the labeling of membrane-associated proteins, such as SOD1, from that of luminal or transmembrane proteins, such as sAPP and Rtn4. Bars = 20 μm.

