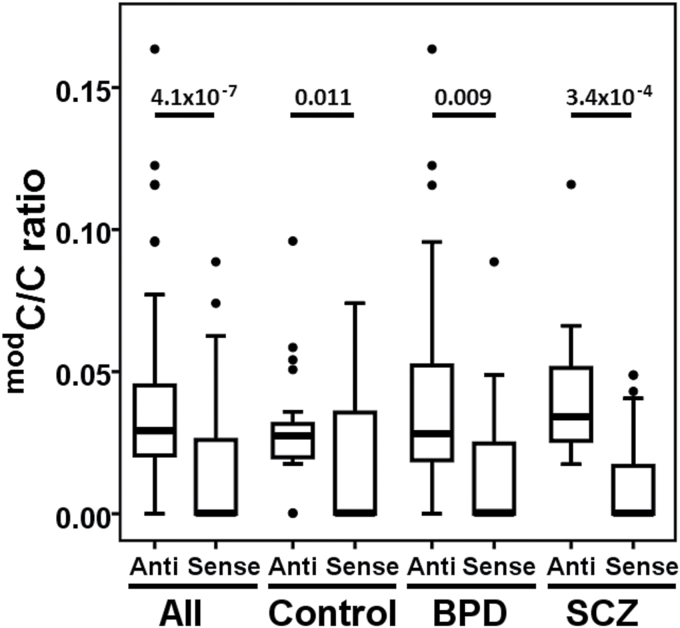
Fig. 2.
Strand bias of CpH modification. Boxplots represent CpH modification density for sense and anti-sense strands for region E and F (chr6: 29945722–815 and 29946419–576, respectively) with equal number of CpH sites on both strands. Significant P values are provided (Wilcoxon signed ranks test) above the boxplots.

