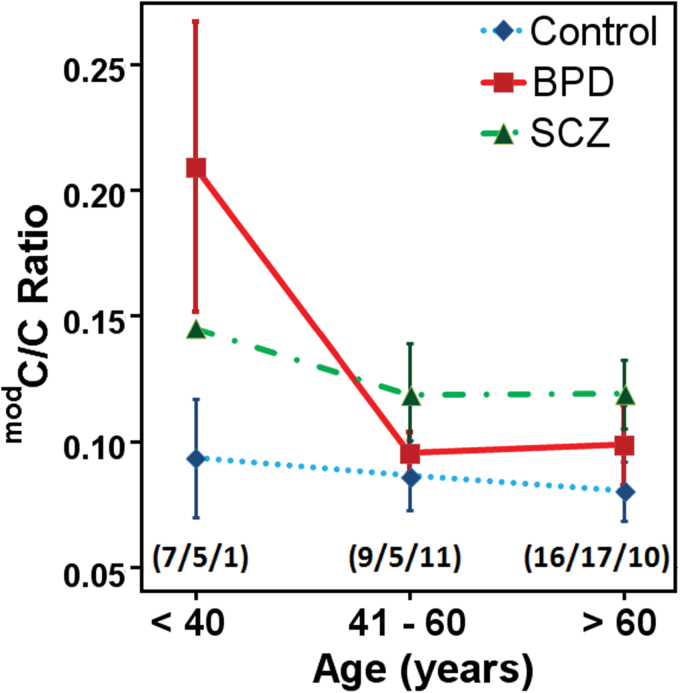
Fig. 4.
Age-stratified changes in HCG9 CpH modification density in the brain. Line plots represent mean CpH modification density for control, BPD, and SCZ individuals for different age groups. Numbers of samples in each age group are presented in brackets as (controls/BPD/SCZ) and error bars represent SEM. Most dramatic difference was observed in BPD age group younger than 40 years compared to the older BPD and SCZ patients as well as controls in all age categories.

