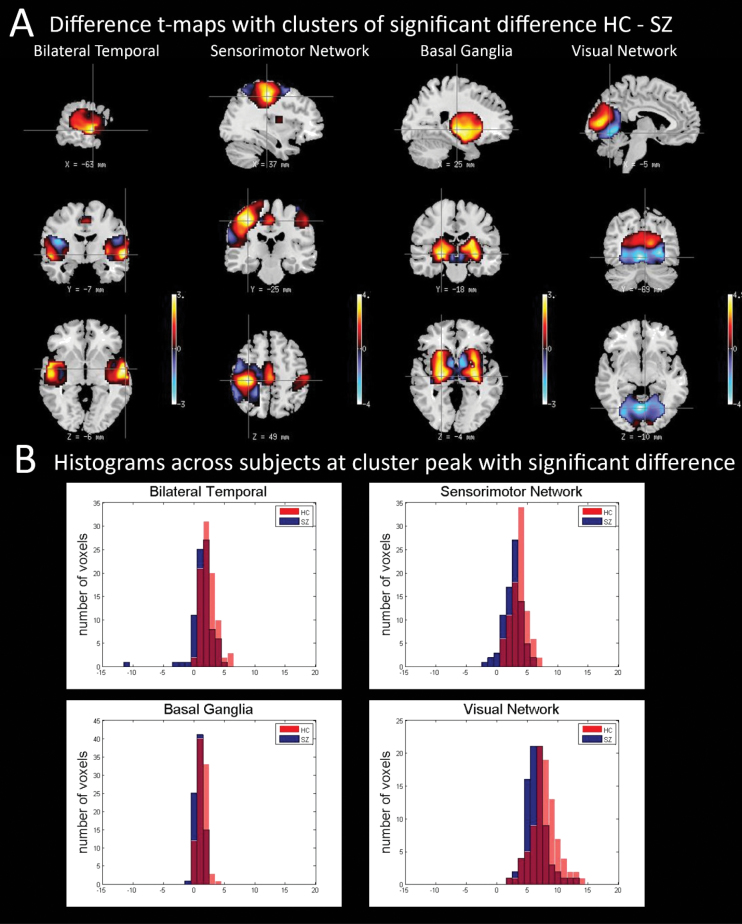
Fig. 2.
(A) t maps of IVA components with statistically significant difference and corresponding mask used. (B) Histogram of amplitude values at the voxel of maximum difference (between groups) for each group both IVA-GL and group independent-component analysis (GICA) for each of the 4 components with significant difference between groups as featured in figure 2A and table 1. In the histograms, the red-colored plots represent histograms for healthy controls (HCs), and the blue-colored plots represent histograms for schizophrenia patients (SZs). The 2 sample t-test P values and the F-test P values for each of the 4 components at the voxel of maximum difference, respectively, are as follows: Bilateral temporal: t-test P value = .00022 (HC > SZ), F-test P value = .00009 (SZ > HC); Sensorimotor: t-test P value = 3.85×10⁻⁶ (HC > SZ), F-test P value = .457; Basal Ganglia: t-test P value = .00059 (HC > SZ), F-test P value = .3015; and Visual: t-test P value = 1.105×10⁻⁵ (HC > SZ), F-test P value = .1322.

