
Figure 7. Effects of the rTAP1(E436R) mutation on transport (A–B) and binding (C–F) of peptides with different net charges (q).
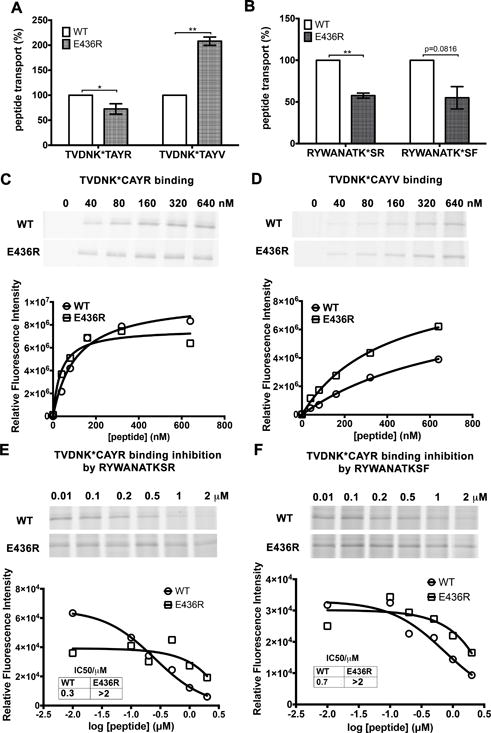
(A) The rTAP1(E436R) mutation reduces transport efficiency for the neutral peptide TVDNK*TAYR (q = 0) but increases transport efficiency for the negatively charged peptide TVDNK*TAYV (q = −1). (B) The rTAP1(E436R) mutation reduces the efficiency of transport of both basic peptides RYWANATK*SF (q = +1) and RYWANATK*SR (q = +2). Peptide transport data are averages of three independent experiments each in triplicate with 2 (A) or a single microsome preparation (B). (C–F) The rTAP1(E436R) mutation increases binding affinities of the negatively charged TVDNK*CAYV (TC6V) (D) nonapeptides, but decreases the binding of two basic decapeptides, RYWANATKSR (RR) (E) and RYWANATKSF (RF) (F). Peptide binding of nonapeptides (C–D) was assessed by direct BMOE-mediated crosslinking assays as described in the Method section. Derived apparent peptide binding affinities from independent experiments for rTAP1(E436R)/TAP2a and wild type TAP complexes were respectively: TC6R, 14.8±9.8 nM vs 90.6±25.6 nM, 36.6±13.4 nM vs 106.9±25.5 nM, 18.9±11.1 nM vs 104.4±11.1 nM, 23.7±8.1 nM vs 43.9±10.9 nM, 90.0±27.9 nM vs 93.9±13.7, p=0.0345. TC6V, 263.2±55.7 nM vs 410.1±143.1 nM, 397.4±50.6 nM vs 790.4±121.9 nM, 345.5±65.1 nM vs 894.0±505.2 nM, 318.0±105.1 nM vs 649.3±248.6 nM, p=0.0067). Peptide binding of decapeptides (E-F) was measured by their competitive inhibition of binding of TC6R (1 μM). K* represents lysine-FITC. For C-F, representative data of two independent experiments with a single microsome preparation are shown. Statistical analyses for A-D are based on paired two-tailed t-tests. *, P ≤ 0.05, **, P ≤ 0.01. Error bars represent SEM values.