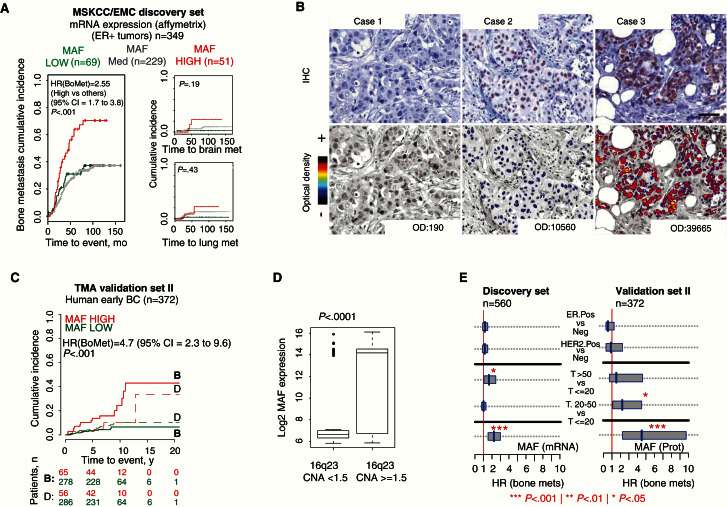
Figure 2.
MAF expression associated with bone metastasis in breast cancer (BC). A) Cumulative incidence plot of bone, brain, and lung metastasis in estrogen recptor–positive (ER+) primary BC patients (discovery MSKCC/EMC dataset). MAF expression: low (<mean - SD), medium (≥ mean - SD and ≤ mean + SD) and high (> mean + SD). P values were obtained after fitting Cox proportional hazard models and performing two-sided likelihood ratio tests. B) Representative MAF immunostainings of primary BC tissues. Case 1 represents MAF-negative tumors (optical density [OD] < 1000). Cases 2 and 3 are MAF-positive tumors (OD > 1000 and > 25000, respectively). Scale bar = 50 μm. C) Cumulative incidence plot of bone metastasis at any time, considering death as a competing event in Spanish dataset. High MAF-expressing group (red line, OD > 1000); low MAF-expressing group (green line, OD < 1000). P values were obtained after fitting Cox proportional hazards model with competing events. D) Box plot with the MAF protein log2 score (immunohistochemistry [IHC], OD values) on the vertical axis and amplified vs not-amplified categories on the horizontal axis. P value scored by two-sided Wilcoxon signed-rank test. Boxes represent interquartile range and median. Whiskers represent minimum and maximum values. E) 95% confidence intervals for the Cox proportional hazard ratios (HRs) are illustrated for the discovery and validation cohort for selected values of covariates represented. MAF is measured at the mRNA level (discovery set) and protein level (validation set). BC = breast cancer; CI = confidence interval; ER = estrogen receptor; HER2 = human epidermal growth factor receptor 2; HR = hazard ratio; OD = optical density.

