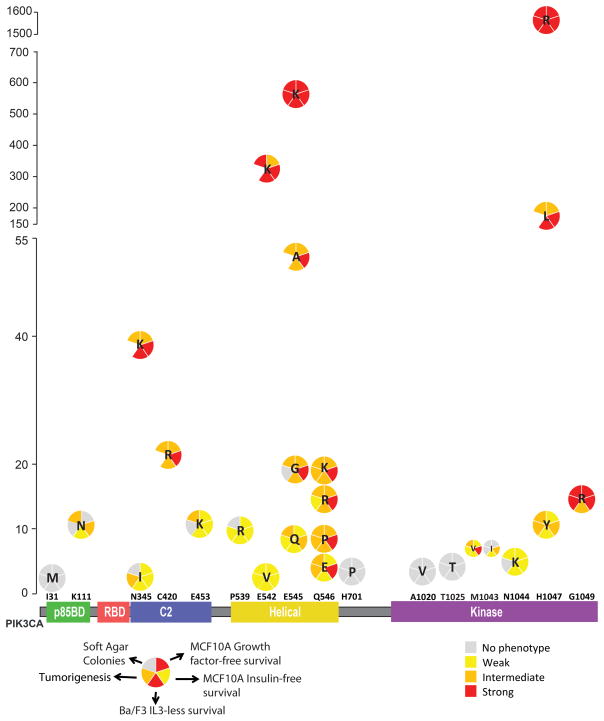
Figure 6. PIK3CA tail mutation activity summary.
X-axis represents the domain structure of PIK3CA protein (p110alpha) with analyzed mutations depicted (x-axis is not to scale). Y-axis represents the occurrence of each mutation based on COSMIC analysis. Relative strength of phenotype for each assay is based on as follows: Ba/F3: Weak=2–15 fold, Intermediate=15–35 fold, Strong>35 fold; Growth factor-free proliferation: Weak=2–4 fold, Intermediate=4–9 fold, Strong>9 fold; No Insulin proliferation: Weak=1.3–2.5 fold, Intermediate=2.5–4 fold, Strong>4 fold and above; Colony formation: Weak=25–35 colonies, Intermediate=35–65 colonies, Strong=>65 colonies; Tumorigenesis: Weak=1–5% representation, Intermediate=5–10% representation, Strong>10% representation.

