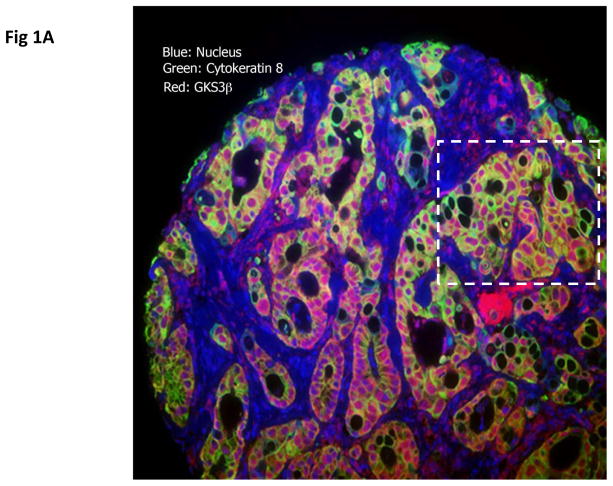
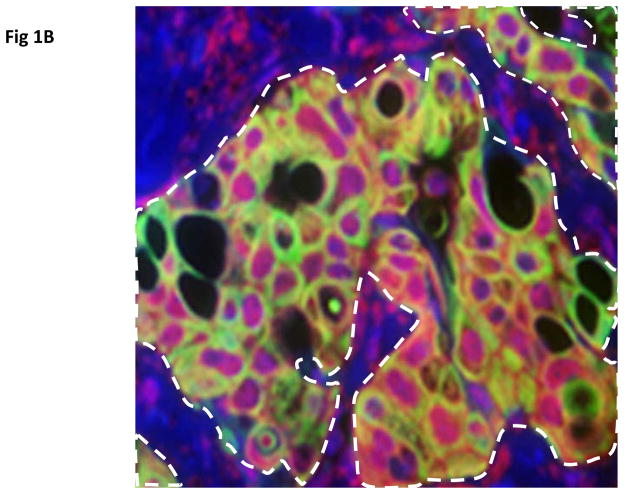
Figure 1.
Automated Quantitative Immunofluorescence Analysis (AQUA). Example of a tumor with GSK3β expression (AQUA score 3819) at low magnification (A) and high magnification (B). Dashed box in (A) represents area of high magnification. Dashed areas in (B) represent the portions of tumor which were scored for GSK3β expression. The cells in this area exhibited positive cytokeratin staining and thereby formed the “tumor mask”.


