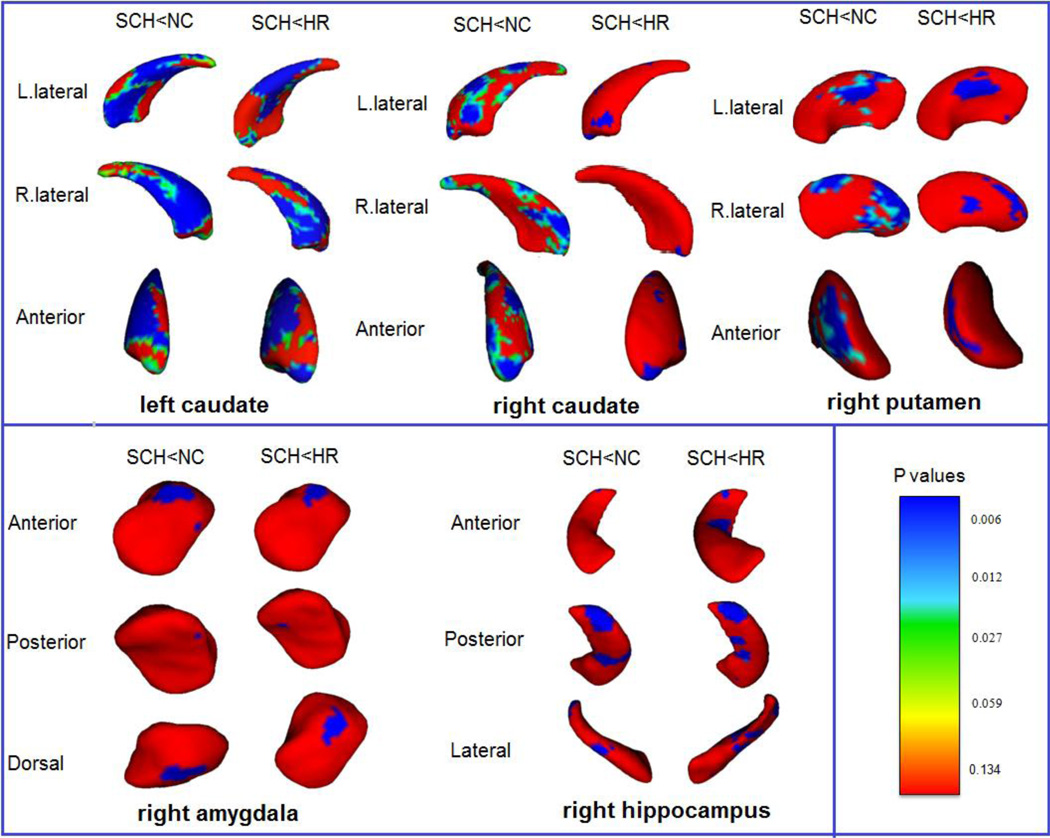
Figure 1.
Statistical maps show significant differences in local atrophy of subcortical regions between SCH and both NC and HR groups. Left caudate nucleus, right caudate nucleus, right amygdala, right hippocampus, and right putamen are shown for both between-group comparisons (SCH vs. NC and SCH vs. HR). FDR corrected figures are shown. SCH: schizophrenia group; NC: normal control group; HR: high-risk group; L: left; R: right. The color-coded bar gives p values, with p = 0.134 (F = 2), p = 0.059 (F = 2.75), p = 0.027 (F = 3.5), p= 0.012 (F = 4.25), and p = 0.006 (F = 5) (degrees of freedom: 3, 32).

