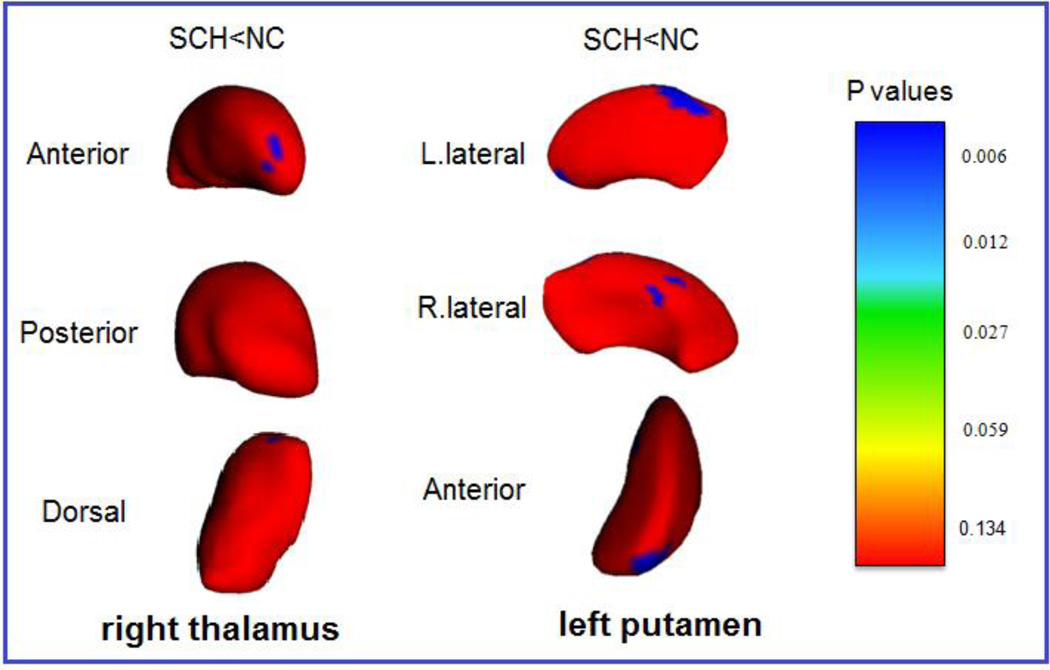
Figure 2.
Statistical maps composed using vertex-based comparison show subcortical regions with only differences between the schizophrenia group and normal control group. Local atrophy of right thalamus and left putamen are shown on FDR corrected figures. L: left; R: right. The color-coded bar gives p values, with p = 0.134 (F = 2), p = 0.059 (F = 2.75), p = 0.027 (F = 3.5), p= 0.012 (F = 4.25), and p = 0.006 (F = 5) (degrees of freedom: 3, 32).

