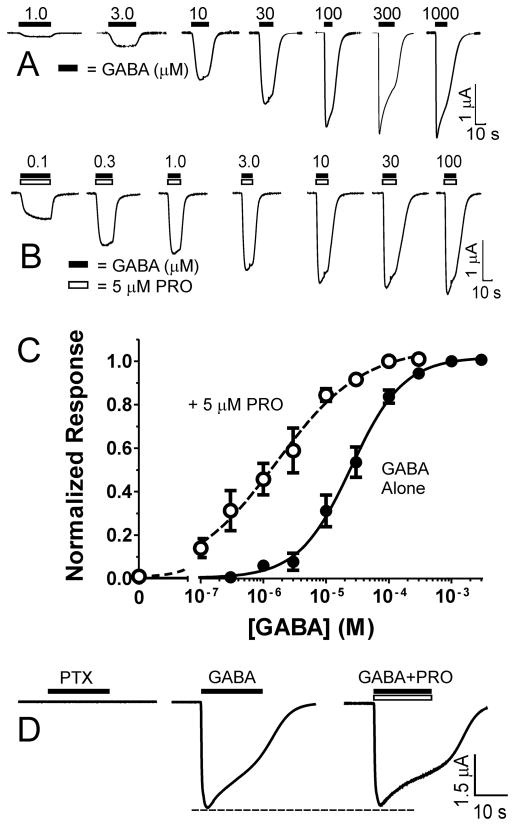
Figure 3. Functional Characterization of α1β3H267Cγ2L GABAA Receptors.
A: Traces are currents measured from a single voltage-clamped oocyte expressing α1β3H267Cγ2L GABAA receptors. Bars over the traces identify GABA concentration (μM) and period of exposure. B: Traces are recorded from the same oocyte as panel A, activated with various GABA concentrations combined with 5 μM propofol (PRO). C: Combined GABA concentration-responses from 3 oocytes in the absence and presence of propofol. Normalized data was fitted with Eq. 1 (methods). Fitted GABA EC50 values are 25 μM with GABA alone, and 1.6 μM in the presence of 5 μM propofol. D: Picrotoxin (PTX) application to a voltage-clamped oocyte expressing α1β3H267Cγ2L receptors reveals an absence of spontaneous gating activity. Combining propofol (10 μM) with maximal (1 mM) GABA does not enhance peak current, indicating that GABA alone activates nearly 100% of receptors.

