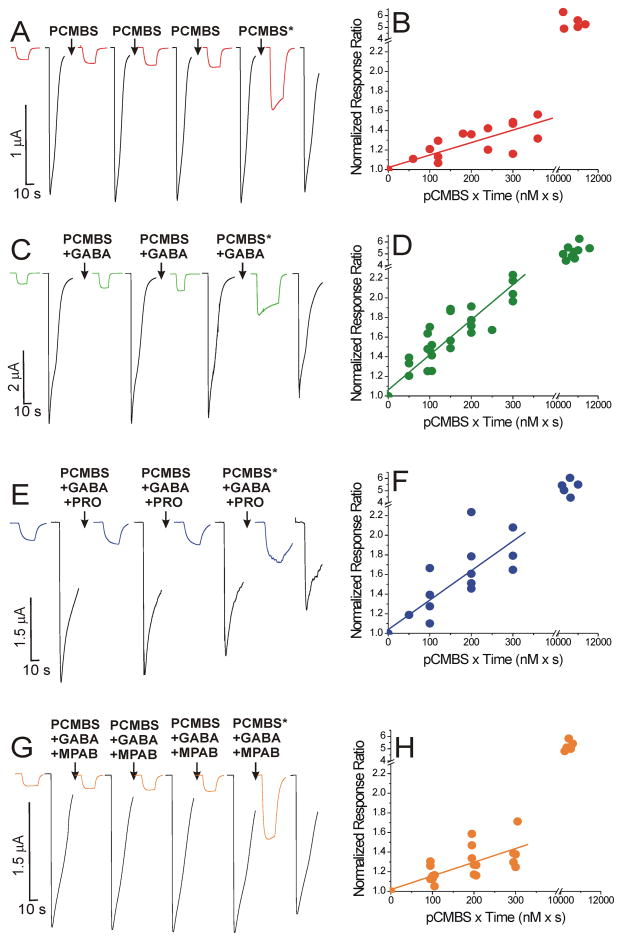
Figure 5. Modification of α1β3H267Cγ2L GABAA Receptors with pCMBS.
The panels on the left show examples of voltage-clamp current traces during modification under four different conditions. Colored traces are responses to 3 μM GABA, and black traces are responses to 1 mM GABA. Arrows indicate modification exposures, which were followed by 5 min wash. The starred arrows indicate exposure to 1 μM p-chloromercuribenzensulfonate (pCMBS) for 10 s. The panels on the right show the corresponding initial linear rate analyses for combined normalized response I3μM/I1mM ratios from all oocytes used for each condition. Points represent the ratio of I3μM:I1mM, normalized to the pre-modification control, and plotted against cumulative pCMBS exposure. Points in the upper right portion of the panel represent response ratios after modification with 1 μM pCMBS. A: Modification in the absence of GABA. Traces are recorded from one voltage-clamped oocyte expressing α1β3H267Cγ2L GABAA receptors before and after sequential 10 s exposures to 10 nM pCMBS. B: Initial modification rate analysis for combined data from all oocytes modified with pCMBS alone (n = 5). The line through the first four points has a fitted slope of 1.3 ± 0.19 × 10⁶ M−1s−1. Maximal normalized response ratio = 5.4 ± 0.25 (n =5; mean ± sem). C: Modification in the presence of GABA. Current responses from a single oocyte during sequential 10 s exposures to 10 nM pCMBS plus 1 mM GABA. D: Initial modification rate analysis for all oocytes modified with pCMBS plus GABA (n = 9). The fitted linear slope is 3.6 ± 0.25 × 10⁶ M−1s−1. Maximal normalized response ratio = 5.2 ± 0.24 (n =8; mean ± sem). E: Modification in the presence of GABA and propofol. Current responses from one oocyte before and after sequential 10 s exposures to 10 nM pCMBS plus 1 mM GABA plus 10 μM propofol (PRO). F: Initial modification rate analysis for all oocytes modified with pCMBS plus GABA and propofol (n = 5). The fitted linear slope is 3.0 ± 0.47 × 10⁶ M−1s−1. Maximal normalized response ratio = 5.3 ± 0.27 (n =5; mean ± sem). G: Modification in the presence of GABA and mTFD-MPAB. Current responses from one oocyte before and after sequential 10 s exposures to 10 nM pCMBS plus 1 mM GABA plus 8 μM mTFD-MPAB (MPAB = R-5-allyl-1-methyl-5-[m-trifluoromethyl-diazirinylphenyl] barbituric acid). H: Initial modification rate analysis for all oocytes modified with pCMBS plus GABA and MPAB (n = 7). The fitted linear slope is 1.4 ± 0.22 × 10⁶ M−1s−1. Maximal normalized response ratio = 5.2 ± 0.18 (n =5; mean ± sem).

