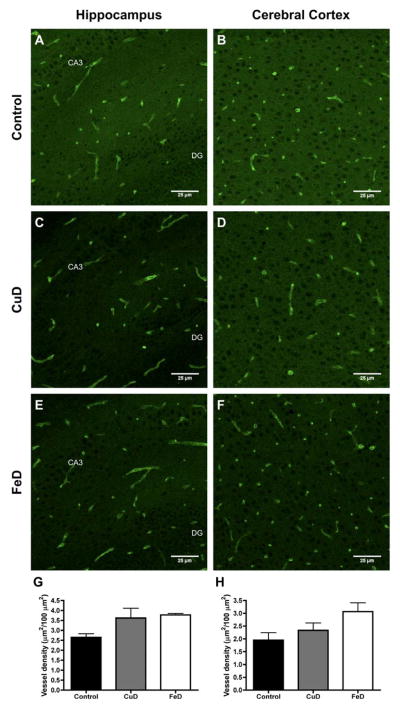
Figure 5. Blood vessel density in the P11 control, copper-deficient, and iron-deficient brain.
GLUT1 immunohistochemistry was performed on 8 μm sagittal brain sections from Exp. 2 P11 female pups. Confocal microscopy was used to visualize blood vessels in the control (n=3), CuD (n=4), and FeD (n=4) hippocampus and cerebral cortex. Representative images are shown in panels A–F. Areal blood vessel density was calculated for each treatment group in the hippocampus (G) and cerebral cortex (H). Data are presented as the mean ± SEM. DG, dentate gyrus. CA3, cornu Ammonis 3.

