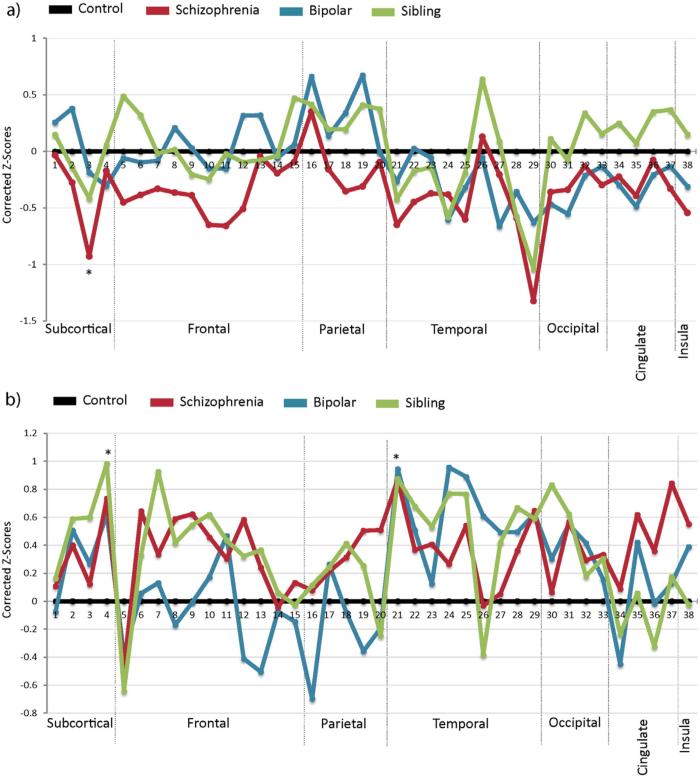
Fig. 1.
Line graphs of regional R2*C and CDEOXY by group. Graphs depict corrected z-scores of R2*C (A), and CDEOXY (B) values averaged for the four participant groups: healthy controls, bipolar disorder, schizophrenia, and the unaffected siblings of schizophrenia patients. z-Scores were corrected for age, and group means normalized against the control group. Values are derived from the each participants median R2*C or CDEOXY voxel values. ROI numbers correspond to regions listed in Table 2. Asterisks represent ROIs where post-hoc ANOVA resulted in statistical significance of p < 0.05.

