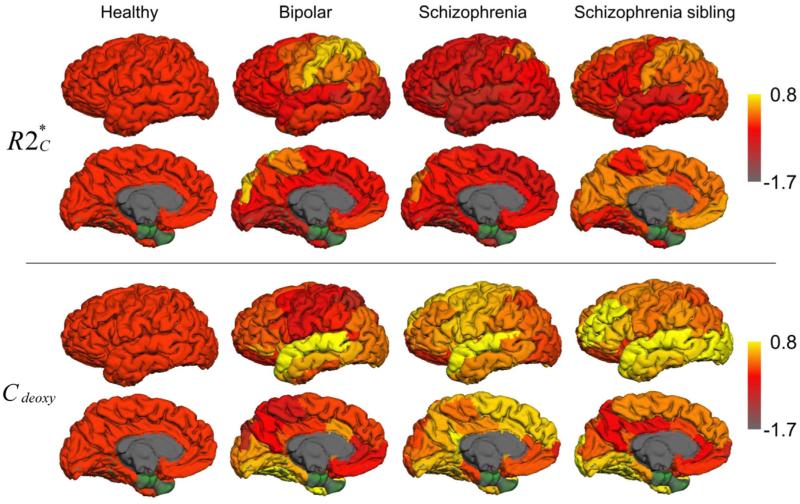
Fig. 2.
Cortical surface depiction of R2*C and CDEOXY by group. Surface maps depict mean R2*C (top), and CDEOXY (bottom) corrected z-scores projected onto cortical ROIs. z-Scores were corrected for age, and group means normalized against the control group. Subcortical ROIs are not depicted. ROIs in green (i.e. entorhinal cortex and temporal pole) were not included in our analyses, as complete GEPCI coverage of these regions was not obtained in a substantial number of participants.

