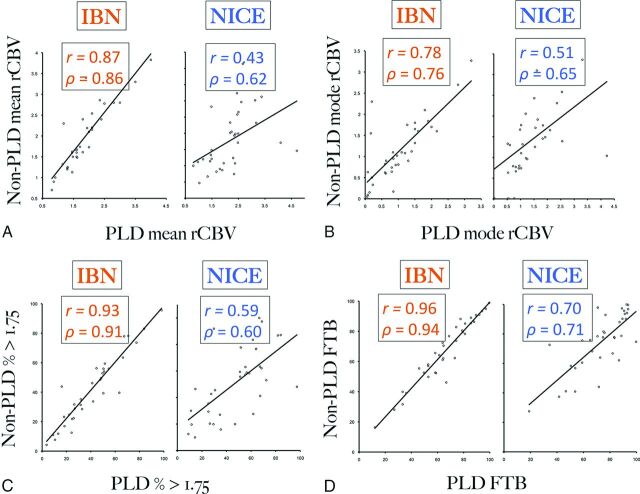
Fig 1.
A–D, Scatterplots correlating rCBV metrics with and without preload dosing (PLD), as measured by 2 separate modeling algorithms (IBN, NICE without γ variate fitting). PLD- and non-PLD corrected values are shown in the x- and y-axes, respectively. Overall, IBN measurements demonstrate consistently higher Pearson (r) and Spearman (ρ) correlations for mean rCBV, mode rCBV, fractional tumor burden (FTB), and percentage of voxels > 1.75. The thresholding metrics (FTB, percentage > 1.75) correlate most strongly between PLD- and non-PLD-corrected conditions.

