
Figure 5.
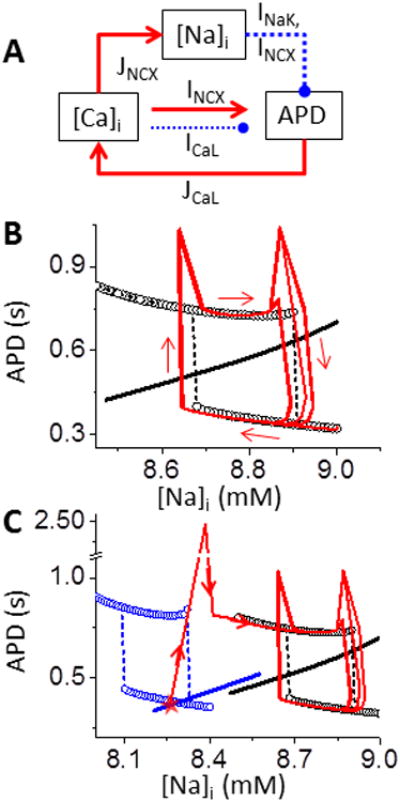
Slow [Na]i accumulation and depletion constitute an EAD bistable switch. A. Schematic diagram of the interaction between [Na]i and [Ca]i-APD. Solid – activation; Dashed - suppression. B. APD-[Na]i phase plot shows hysteresis loop due to bistability. APD nullcline (circles) and [Na]i nullcline (black line, calculated by AP clamp in Fig. S1B) do not intersect either stable branch, so APs of the whole system oscillate around the bistable regime (red and arrows). C. Decreasing GCa shifts both nullclines to lower [Na]i (blue), allowing intersection at the low stable branch (red star). Thus, the system stays at a steady-state short AP without EADs (corresponding to traces at t<0 ms in Fig. 2). Red lines and arrows illustrate the APD sequence in Fig.2.