
Figure 5.
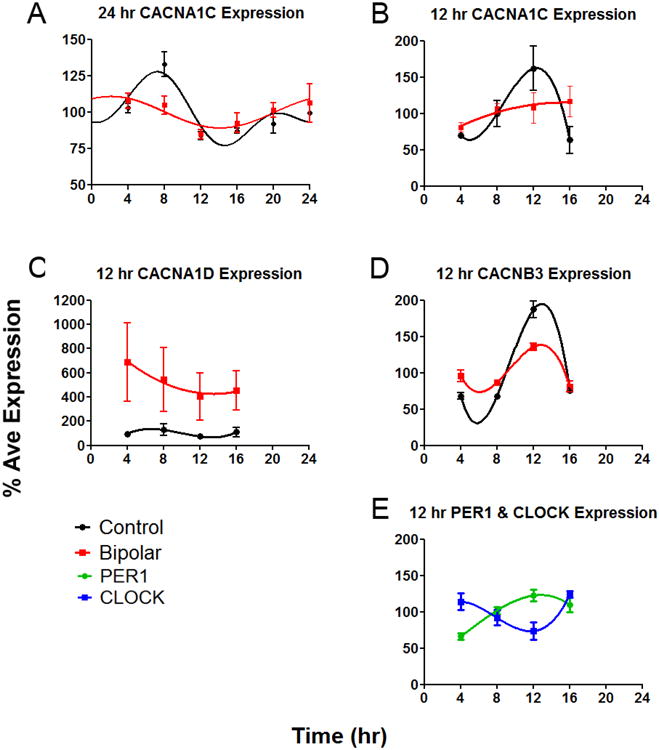
Gene expression profiles using fibroblasts from BD patients (n=4) and controls (N=3) A) Expression profiles and best fit curves indicate that expression of CACNA1C is rhythmic over 24 hr, but more so in controls compared to BD cells. Phase in 24 hr (A) and 12 hr (B-E) experiments may differ due to minor technical differences between experiments. To allow direct comparison to other genes, B) the 12 hr profile of CACNA1C is shown. C) CACNA1D expression over 12 hr was higher in BD compared to controls. D) Amplitude of CACNB3 expression over 12 hr was lower in BD compared to controls. E) PER1 and CLOCK were used as phase markers after combining BD and control samples. As expected, expression of these genes varied over time with opposite phases.