Figure 2.

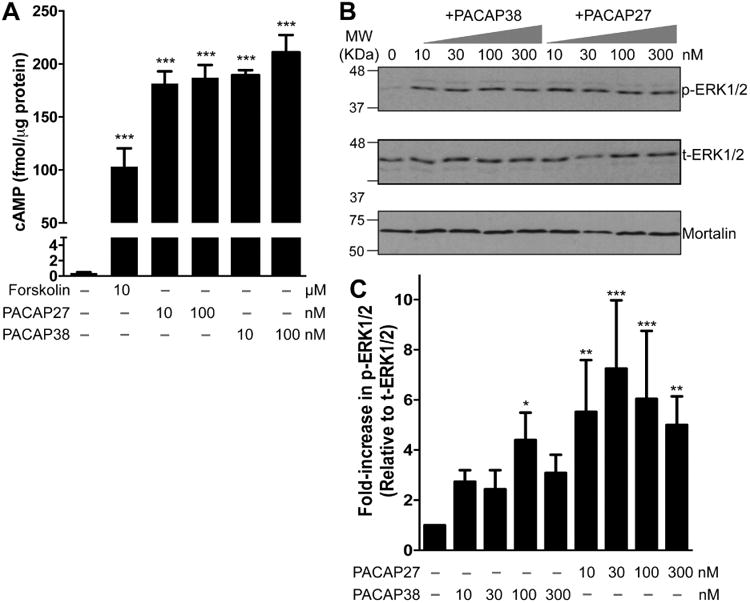
Functional expression of PAC1 in cultured rat hippocampal neurons. A, ELISA-based quantification of intracellular cAMP levels following treatment with PACAP27 (10 and 100 nM), PACAP38 (10 and 100 nM), and forskolin (10 μM) for 20 min. Increased intracellular cAMP levels upon PACAP treatment are indicative of functional Gαs-coupled PAC1 expression in these neurons. Data are presented as mean ± SEM (n = 4). *** denotes p<0.05, significantly different compared to control or untreated condition (One-way ANOVA with Dunnett's multiple comparisons test). B, Representative immunoblot analysis of ERK1/2 phosphorylation in neurons without or with the treatment of either PACAP27 (10, 30, 100 and 300 nM; 20 min) or PACAP38 alone (10, 30, 100 and 300 nM; 20 min). Numbers on the left denote the relative mobility of molecular weight markers. t-ERK1/2 and p-ERK1/2 denote total-ERK1/2 and phospho-ERK1/2, respectively. The bottom row shows sample normalization for same samples probed with anti-mortalin antibody. D, Quantification of p-ERK1/2 levels in neurons from experiments as shown in panel C. Data are presented as mean ± SEM fold-increase in p-ERK1/2 levels relative to t-ERK1/2 levels, normalized to control or untreated conditions, as detailed in methods (n = 4-5). * denotes p<0.05, ** denotes p<0.01 and *** denotes p<0.01, significantly different compared to control or untreated condition (One-way ANOVA with Dunnett's multiple comparisons test).
