Figure 3.

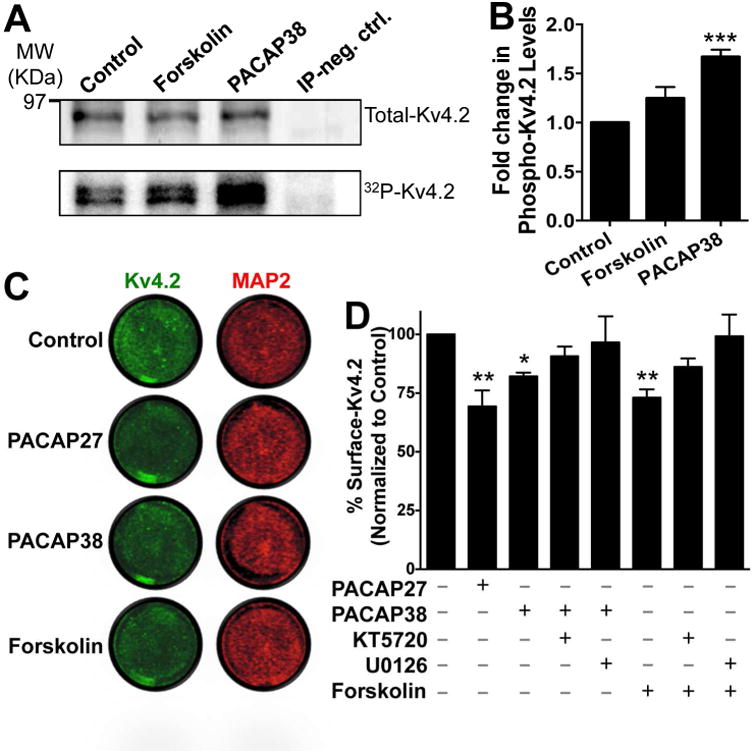
PACAP treatment of cultured rat hippocampal neurons leads to increased phosphorylation and a decrease in the surface expression level of Kv4.2 protein. A, Representative immunoblot (top row) and phosphor-imaging (bottom row) images of immunoprecipitated Kv4.2 protein from cultured hippocampal neurons pre-incubated with 32P-labeled orthophosphate. Number on the left denotes the relative mobility of protein molecular weight marker. Treatment of neurons with PACAP38 (100 nM) or forskolin (10 μM) for 20 min led to increased 32P signal intensities of Kv4.2 protein band, which were quantified (B) using the NIH Image J software. IP neg. Ctrl, denotes sample obtained with immunoprecipitation using anti-PP2A catalytic subunit antibody from cultured hippocampal neurons pre-incubated with 32P-labeled orthophosphate, in order to serve as a negative control. Data in panel B are expressed as mean ± SEM fold change in 32P signal intensities of Kv4.2 normalized to the total immunoprecipitated Kv4.2 protein in each individual treatment group (n = 4). *** denotes p<0.001, significantly different compared to control or untreated conditions (One-way ANOVA with Dunnett's multiple comparisons test). C, Representative images of cultured neurons from on-cell fluorescence immunocytochemical experiments, immunostained with anti-Kv4.2 antibody (green; before permeabilization) and anti-MAP2 antibody (red; after permeabilization), under control or untreated conditions, and upon treatment with PACAP (100 nM each) or forskolin (10 μM) for 20 min. Infrared signal intensities for each set of images were acquired using the same exposure time, and surface Kv4.2 signal intensities, relative to MAP2 signal intensities, were calculated using NIH ImageJ. Data are presented as mean ± SEM of % surface Kv4.2 levels normalized to control or untreated conditions in panel D (n = 5 for PACAP groups, and 4 for forskolin groups). Exposure of neurons to PACAP27 or PACAP38 or forskolin significantly decreased the % of surface Kv4.2 levels, an effect that was absent upon pre/co-treatment of neurons with the inhibitors of PKA (KT5720; 1 μM) and MEK1/2 (U0126; 1 μM). * denotes p<0.05 and ** denotes p<0.01, significantly different compared to control or untreated conditions (One-way ANOVA with Tukey's multiple comparisons test).
