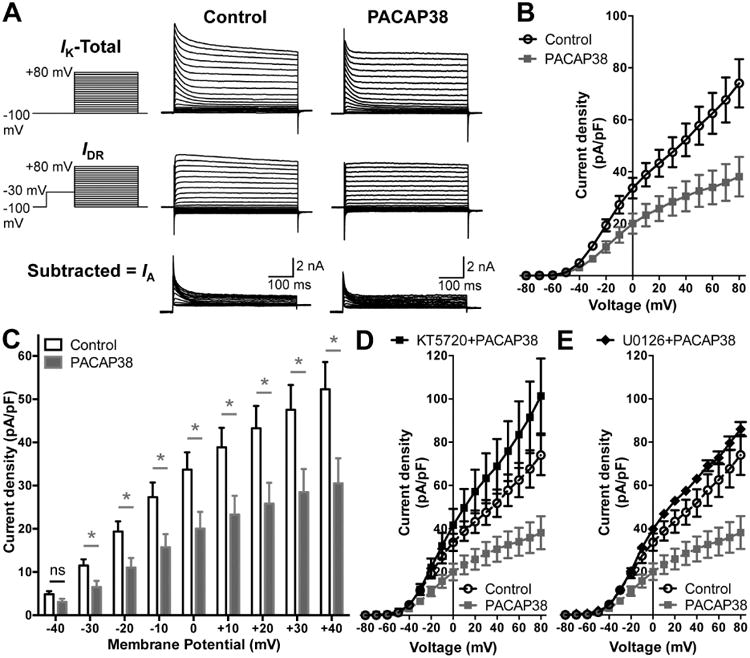
Figure 4.

Reduction of A-type K+ (IA) currents in hippocampal neurons following PACAP38 exposure. A, Representative traces of whole-cell voltage-clamp recordings showing electrophysiological isolation of IA in cultured rat hippocampal neurons. Total outward K+ currents (IK) were obtained with step-depolarization from -100 mV to +80 mV for 500 ms in +10 mV increments, from a holding potential of -100 mV. Delayed rectifier currents (IDR) were obtained by applying a -30 mV pre-pulse for 500 ms before step-depolarization from -100 mV to +80 mV for 500 ms in +10 mV increments, in order to inactivate IA. Isolation of IA was achieved by subtracting IDR from IK. PACAP38 treatment (100 nM, 20 min) led to reduction in IA amplitude, as quantified in panel B showing the current density – voltage plots, and re-plotted showing PACAP effects at physiologically-relevant voltages (-40 mV to +40 mV) in panel C. Data in panels B and C are presented as mean ± SEM obtained from multiple batches of cultured neurons without (control) or with PACAP38 treatment (n = 12 for both groups), ns: not significantly different, and * denotes p<0.05, significantly different compared to control or untreated conditions (Unpaired Student's t-test). D-E, current density – voltage plots of IA currents recorded from neurons with PACAP38 treatment (100 nM, 20 min) along with the inhibitors of PKA (KT5720; 1 μM) or MEK1/2 (U0126; 1 μM), showing attenuation of the PACAP38-induced decrease in IA density. Current density data for control and PACAP38 treatment from panel B are re-plotted here as dashed lines for direct comparison. Data are presented as mean ± SEM obtained from multiple batches of cultured neurons (n = 10 for KT5720+PACAP38; and n = 8 for KT5720+PACAP38 treatment groups).
