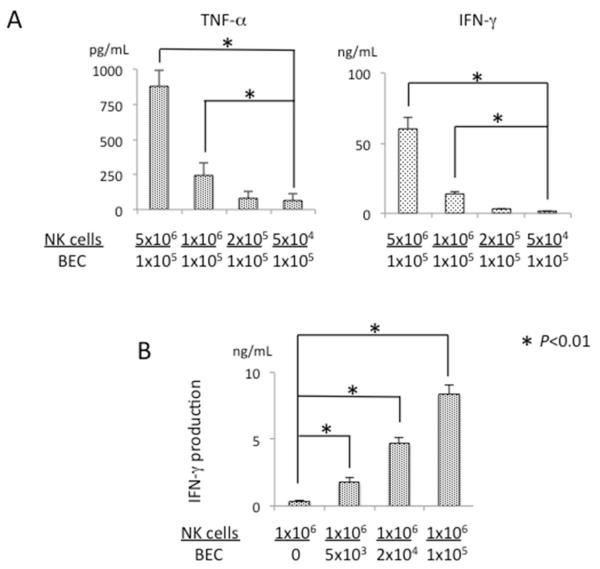
Figure 3.
BEC induced TNF-α and IFN-γ production from activated NK cells. A. Activated NK cells were co-cultured with autologous BEC (1×10⁵ per well) in triplicate at serial NK/BEC ratios for 24 hours. Results are presented as mean +/− S.D. *, significant differences (p<0.01) between NK cells: 5×10⁴ versus 1×10⁶ or 5×10⁶. B. Activated NK cells (1×10⁶ per well) were co-incubated with BEC for 24 hours. The concentrations of TNF-α and IFN-γ in the conditioned medium were measured by ELISA. Results are presented as mean +/− S.D. *, significant differences (p<0.01) between BEC: 0 versus 5×10³, 2×10⁴ or 1×10⁵.

