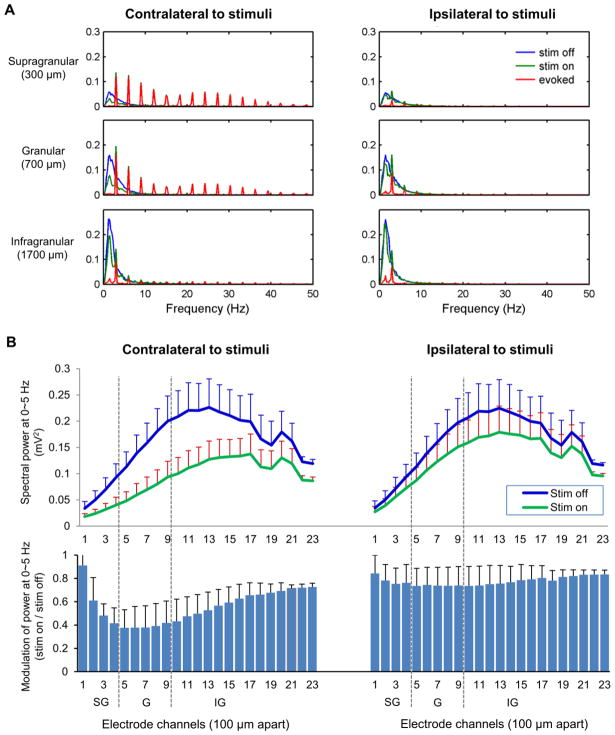
Fig. 2.
Spectral power distribution of spontaneous LFP activity (in mV2) and its modulation by sensory stimulation (n = 6). a Spectral power distribution of spontaneous LFP activity at the supragranular, granular and infragranular layers (300, 700 and 1700 μm depth, respectively). A majority of spontaneous LFP power during stimulation-off blocks (blue, ‘stim off’) is concentrated in low frequency range of 0~5 Hz. The power of the average evoked LFP responses (red, ‘evoked’) is exhibited as peaks of 3 Hz harmonics. The power of LFP activity during forelimb stimulation blocks (green, ‘stim on’) consists of both 3 Hz harmonics peaks and a low frequency component with decreased magnitude. b Modulation of low frequency (0~5 Hz) power by sensory stimulation was profound in around the granular layer of contra-stimulus hemisphere (Mean ± S.E.M). SG: supragranular layer (Layer 1–3), G: granular layer (Layer 4), IG: infragranular layer (Layer 5–6)

