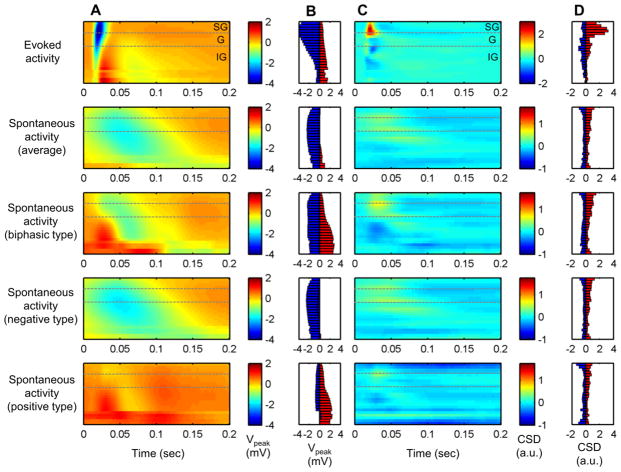
Fig. 3.
LFP polarization and current source density (CSD) of evoked activity and each type of spontaneous activity (n = 6). The averaged LFP activity profile (in mV) revealed slower dynamics in spontaneous activities (a). Spontaneous activity, particularly biphasic type, tends to be stronger in granular and infragranular layers (b). Positive (red) and negative (blue) peak voltage of LFP (in mV). Spontaneous activity had gradual current sink and sources in relatively lower locations than evoked activity as shown in averaged cortical source density profile (c) and peak magnitude of current sink and source (d). Current sink is depicted as positive value (red) and source as negative (blue) in arbitrary unit

