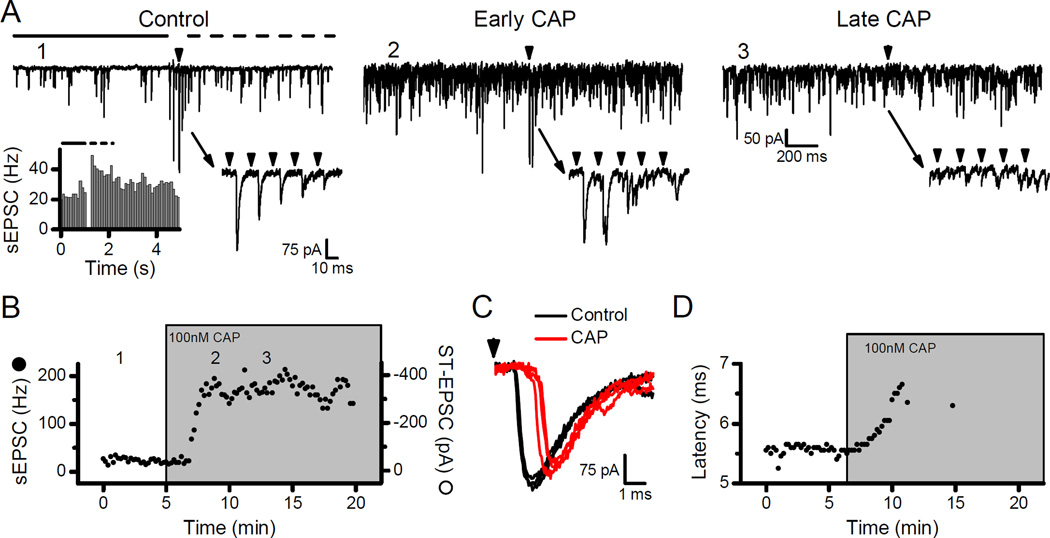
Figure 1.
Capsaicin (CAP) increased the frequency of sEPSCs but inhibited action potential evoked ST-EPSCs from TRPV1+ afferents. In all examples, the arrowheads represent shocks to the ST. A) Control: Stimulation of the ST with a 5-pulse train (50 Hz) produced frequency dependent depression of the ST-EPSC amplitude (lower right inset). Immediately following stimulation the sEPSC frequency transiently increased (top panel, period marked with dashed line) compared to the pre-stimulation (top panel, solid line). This transient increase, termed asynchronous release, indicated a neuron likely receiving TRPV1+ afferents (left inset, 25 trials combined). Numeral labels (e.g. 1) indicate the timing of these original traces in the diary plot of B. Early CAP: 100 nM CAP dramatically elevated the rate of sEPSCs but ST shocks still evoked ST-EPSCs (lower right inset). Late CAP: After 7–10 minutes of exposure to CAP, the sEPSC rate remained elevated but ST shocks failed to evoke ST-EPSCs (lower right inset). B) Diary plot displays the time course of sEPSC frequency (solid circles) and ST-EPSC amplitude (open circles) changes to application of CAP. The sEPSC rate rapidly increased after 2–3 minutes of CAP perfusion but ST-EPSC failures appeared after 5–10 minutes and were often preceded by nearly full amplitude ST-EPSCs. C) Nearly synchronous with the onset of elevated sEPSC rates in CAP (gray or red) the latency of the ST-EPSC began to increase (Control, black). D) Diary plot of the ST-EPSC latency values before failures occurred in the presence of CAP.

