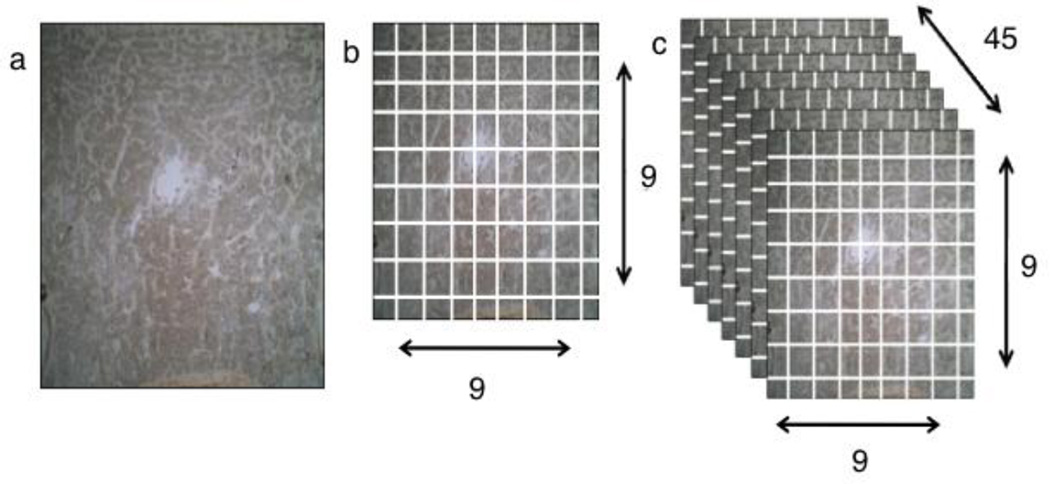
Figure 2.
Methodology used in quantifying the spatial distribution of PGP 9.5 positive nerves. (a) 40× total magnification view of a marked coronal slide. (b) Image is divided into 81 distinct ROI. (c) With 81 ROI per slide and 45 slides total, there was a total of 3,645 ROIs used in this study. The data were combined to form a single 3 dimensional rendering.

