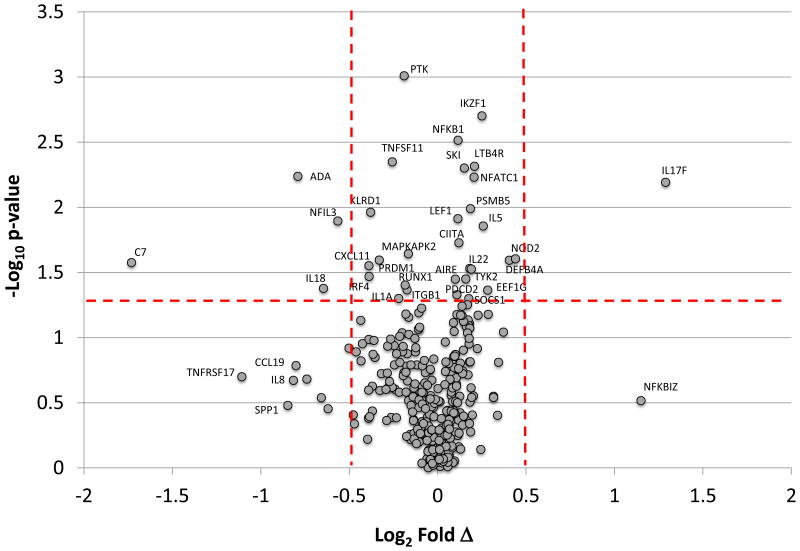
Figure 3.
Volcano plot identifying gene expression profiles between young tissues and all other combined age groups based upon p-value and fold expression. The red horizontal dashed line denotes p-value <0.05 and the vertical dashed lines denote differences in expression between young and other age groups at ±1.4 fold (log2 = +0.5).

