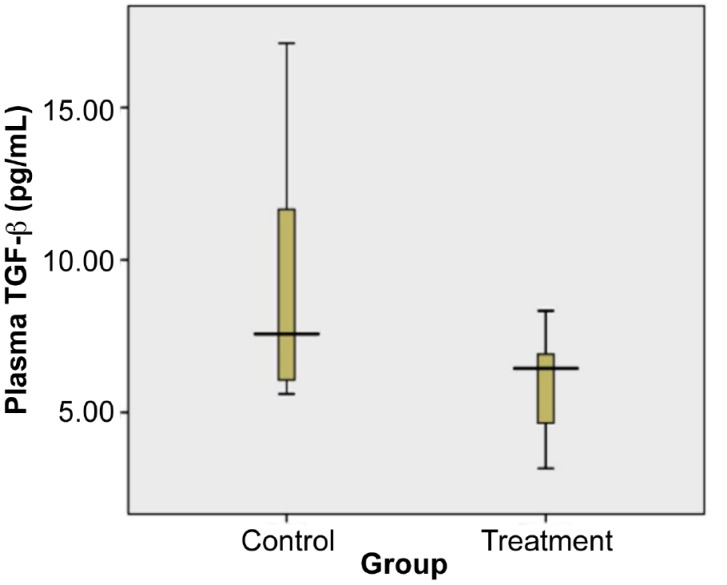
Figure 5:
Levels of Plasma TGF-β of control and treatment group on day 18. Plasma TGF-β of treated group was significantly lower than in the control group (= = 0.05, independent t test). A total samples were 17. The mean (SD) of control group was 9.69 (SD 4.43) (n = 8) and treatment group was 5.99 (SD 1.85) (n = 9).

