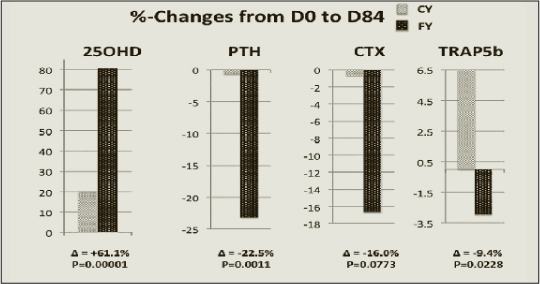
Figure 3.

Values are means in percent after 84 days (D84-D0/D0 x 100) of intervention in subjects consuming non-fortified control (CY) and fortified yogurts (FY), respectively. Δ = Difference in percent between CY and FY groups; Number of subjects: 24 in each group; P. Probability levels for the differences D84-D0, calculated either by the two-sided Student t test or by the Mann-Whitney U test, whether the values were normally distributed (PTH and TRAP5b) or not (CTX and 25OH).
