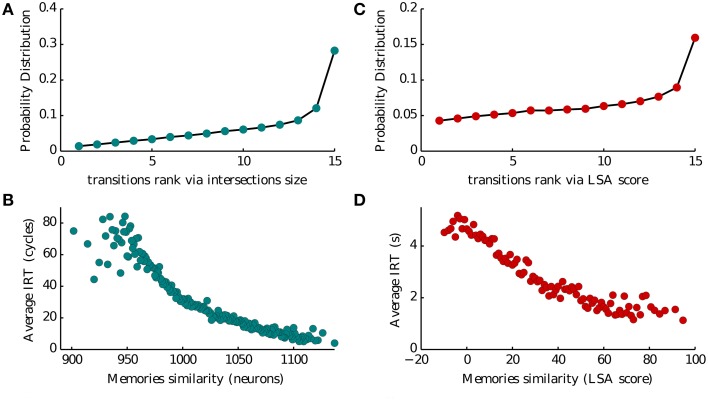
Figure 5.
Memory transitions. (A,C) Probability density of transitions between two subsequent recalled memories as a function of the ranked size of their intersection (1–15 going from the less to the most similar) and of their Latent Semantic Analysis score (LSA). (B,D) Average IRT between two subsequent recalled memories as a function of the size of their intersection (in number of neurons) and of their Latent Semantic Analysis score (LSA).

