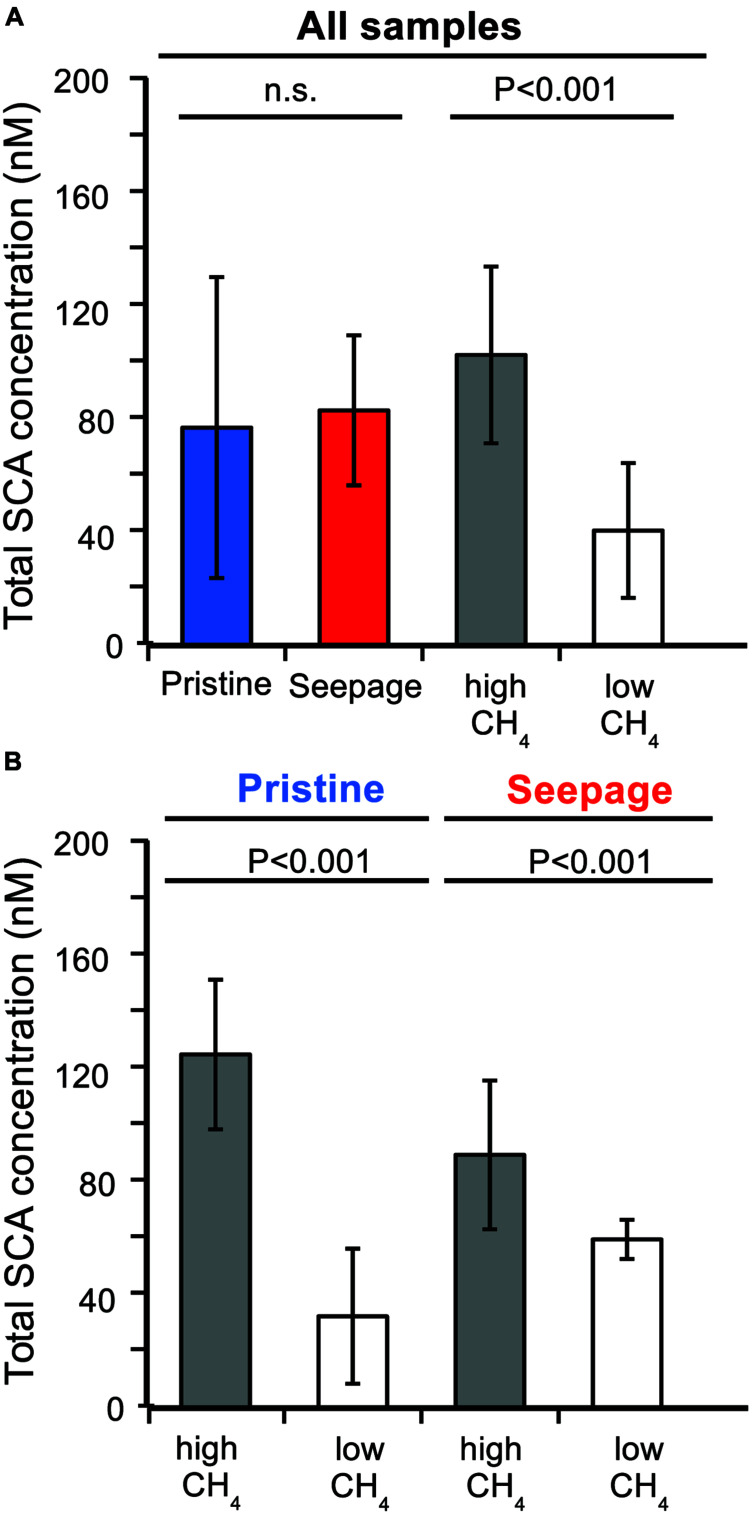
FIGURE 1.
Average total SCA concentrations in pristine and seepage-impacted sediments. (A) Comparison based on all samples grouped according to sediment type (pristine vs. seepage) and methane concentrations (high: LF1, LF4, SKA5, M5; low: BB, SKA1, SKA3, SKA4). (B) Separate comparisons for pristine and seepage sediments, respectively. P-values are indicate based on Student’s t-test. n.s., not significant (P > 0.05).

