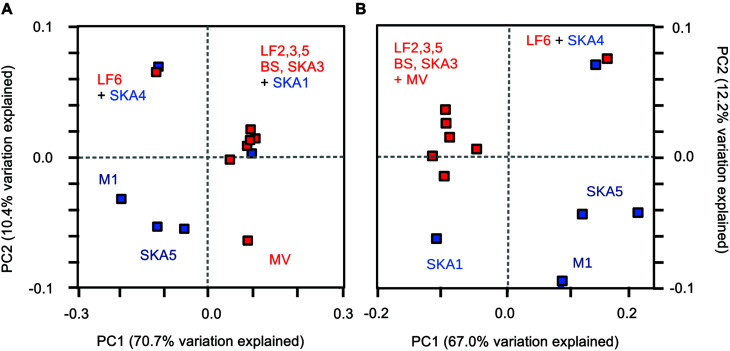
FIGURE 6.
Phylogenetic dissimilarity between samples as assessed by principle coordinate analysis (PCoA) based on weighted UniFrac distances. OTUs were defined at a sequence cut-off of 95% amino acid sequence identity, and PCoA analysis was performed including (A) all OTUs and (B) excluding the two most abundant OTUs from the analysis. Red symbols: seepage sediments, blue symbols: pristine sediments. Sequences from MV enrichments were excluded from the analysis.

