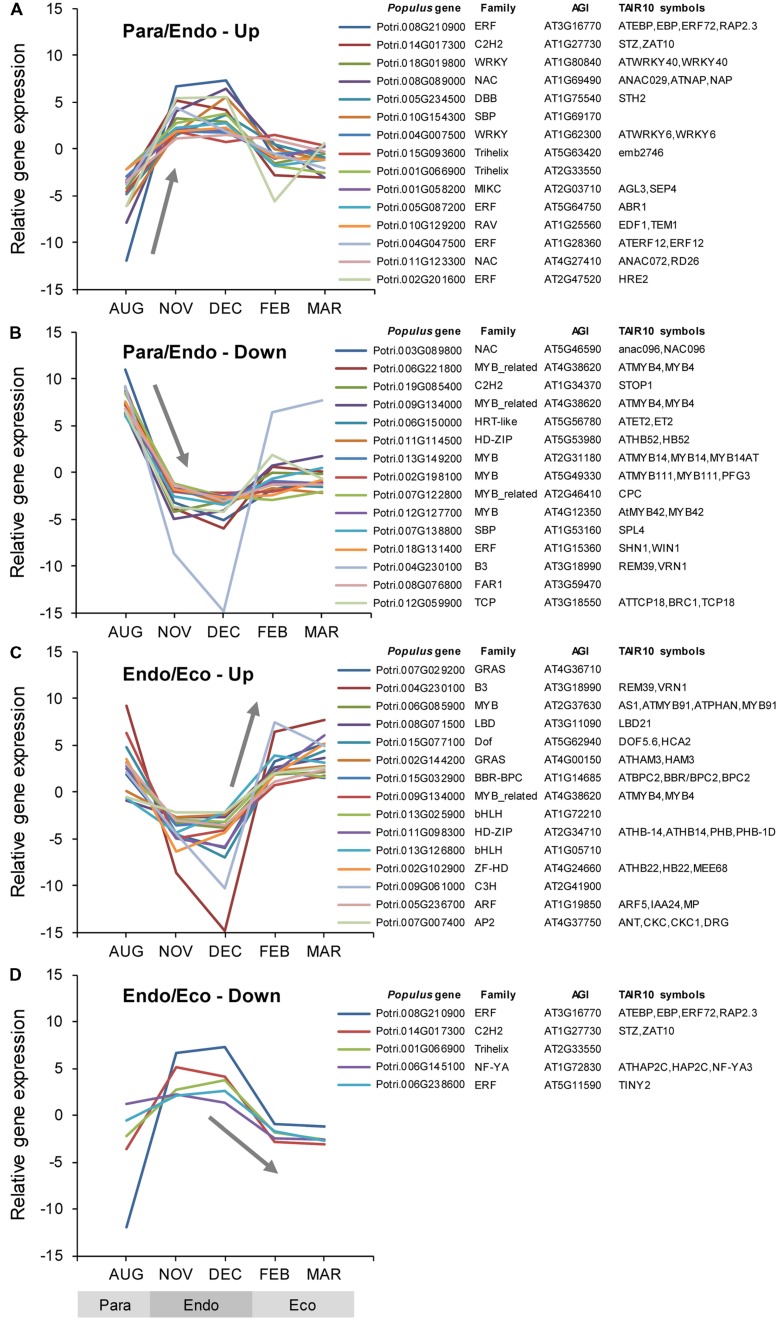
FIGURE 4.
Relative expression of differentially expressed transcription factor genes. Transcription factor genes were identified using the P. trichocarpa and A. thaliana Plant Transcription Factor Databases v3.0 (TFDB; Jin et al., 2014; http://planttfdb.cbi.pku.edu.cn/). Genes were classified into four groups: up-regulated or down-regulated from paradormancy to endodormancy (A,B), or up-regulated or down-regulated from endodormancy to ecodormancy (C,D). Within each group, we ranked genes by FDR p-value, and then displayed the top 15 genes for each group if they had a FDR p-value < 0.05. Gene expression values are the means for each month normalized to a mean of zero and a standard deviation equal to the ANOVA RMSE from the analysis of gene expression differences among months. Family is the TFDB family designation for the corresponding Arabidopsis gene, Populus gene is the P. trichocarpa gene-locus name, and AGI and TAIR10 symbols are the Arabidopsis gene identifiers and gene symbols from the P. trichocarpa v3.0 annotations (http://www.phytozome.net/).

