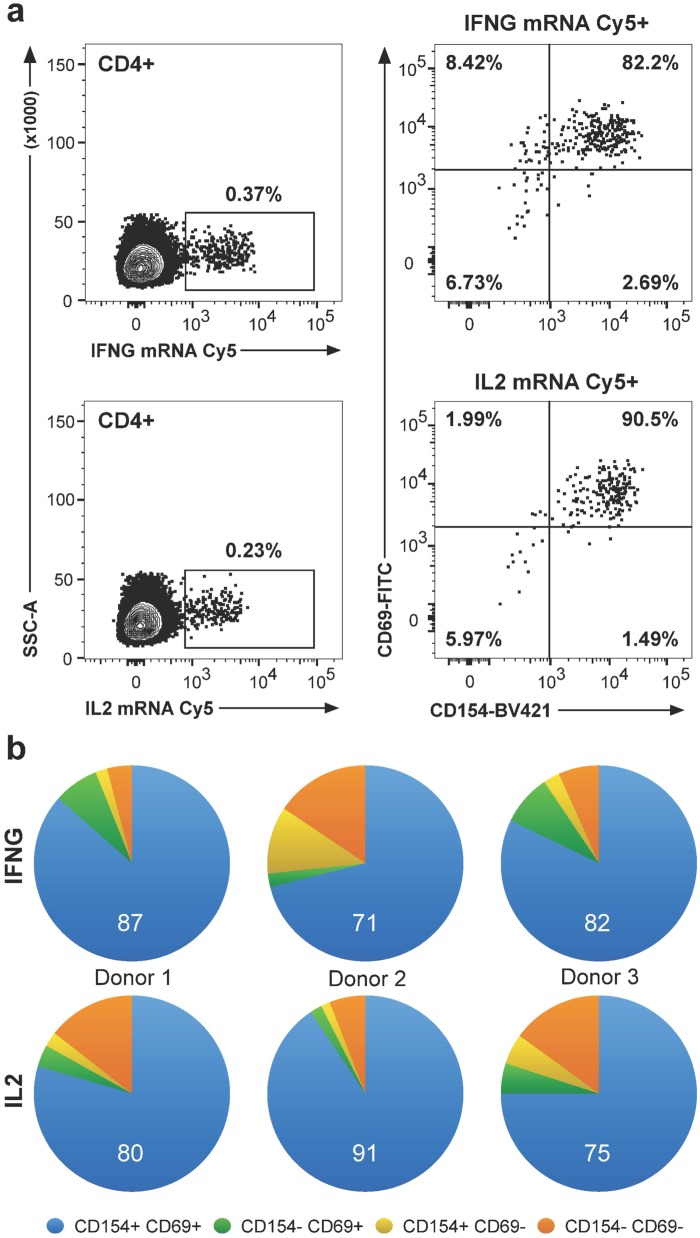
Fig 5. Expression of CD69 and CD154 activation markers in CD4+ T cells.
PPD-stimulated PBMC from LTBI+ donors were co-cultured with αCD154 antibody, stained for CD69, CD4, and CD3, probed with Cy5-labeled IFNG and IL2 nucleic acid probes, and analyzed by flow cytometry. Gates were set based on unstimulated negative controls, SEB-stimulated positive controls, and FMO controls. The scatter plots show data from one donor and the pie charts from three donors. (a) Frequencies of cytokine mRNA+CD4+ T cells (left panels) and CD69 and CD154 expression in mRNA+CD4+ T cells (right panels). The upper right quadrant shows mRNA+CD69+CD154+ cells. Cytokine: IFNG (top row) and IL2 (bottom row). (b) Frequencies of all combinations of CD69 and CD154 expression in IFNG+ (top row) and IL2+ (bottom row) CD4+ T cells, one donor per column.

