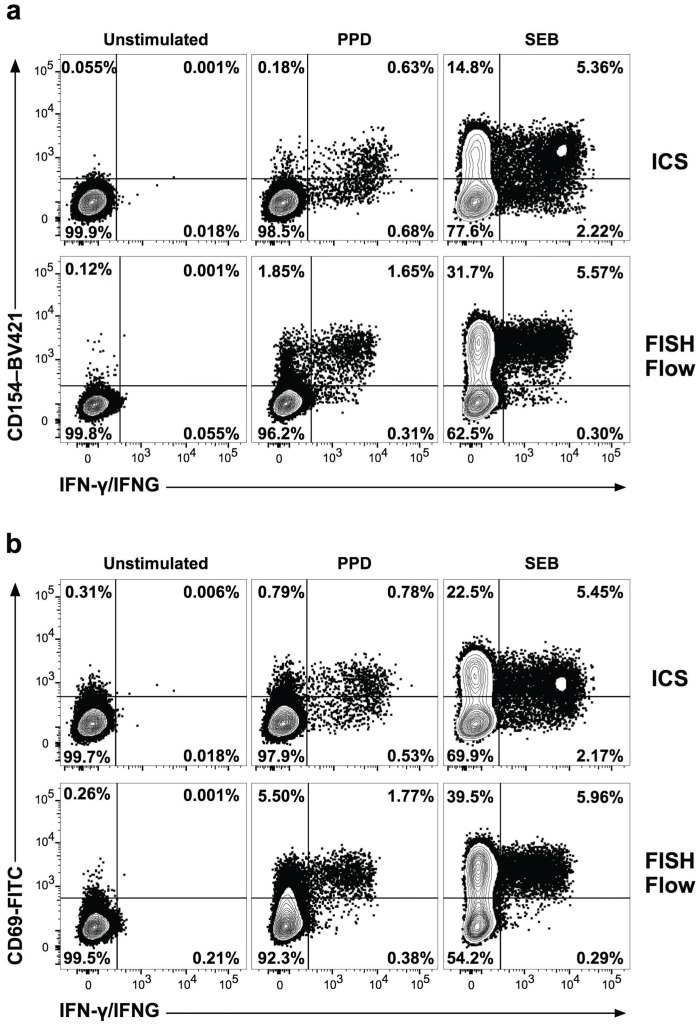
Fig 6. Comparison of FISH-Flow and intracellular cytokine staining (ICS) for detection of antigen-specific T cell responses.
PBMC from an LTBI+ donor were stimulated with PPD, SEB, or left unstimulated. All cells were co-cultured with αCD154 antibody, stained for CD69, CD4, and CD3, probed with Cy5-labeled IFNG (FISH-Flow) or Alexa 647 IFN-γ antibody (ICS), and analyzed by flow cytometry. In the ICS assay, samples were incubated in the presence of 2 μM monensin. Gates were based on unstimulated negative controls and FMO controls. (a) Frequencies of IFN-γ protein+ (IFN-γ) or IFNG mRNA+ (IFNG) cells among CD4+ T cells expressing the CD154 T cell activation marker. (b) Frequencies of IFN-γ protein+ (IFN-γ) or IFNG mRNA+ (IFNG) cells among CD4+ T cells expressing the CD69 T cell activation marker.

