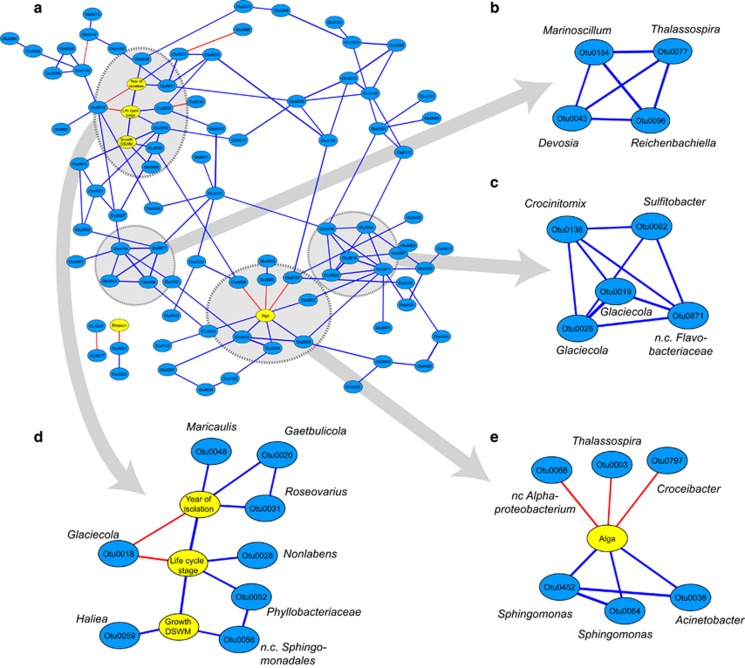
Figure 5.
Correlation networks of OTUs (blue) and alga-related factors (yellow). Blue edges represent significant (P<0.001; false discovery rate<3.4%) positive correlations (Kendall-tau), red edges significant negative correlations. Panel a represents an overview of the network; panels b and c represent tightly connected groups as identified using the MCODE plugin in Cytoscape; panels d and e show sub-networks containing only the direct neighbors of selected alga-related factors; ‘n. c.'=non cultivated.

