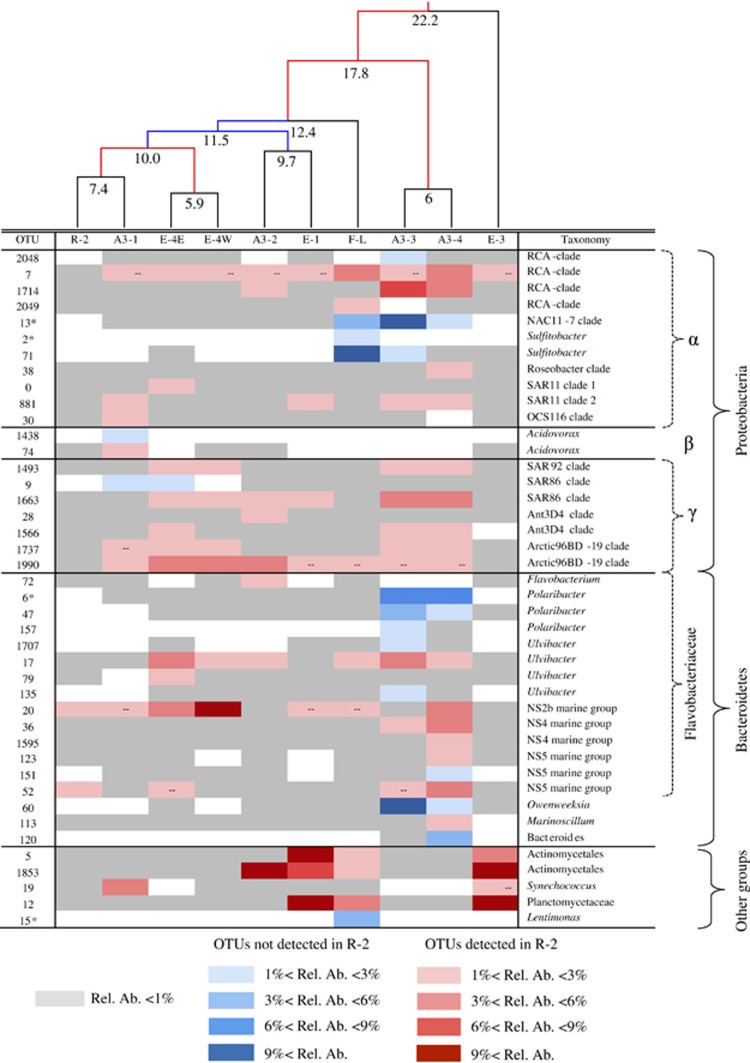
Figure 2.
Heatmap of the OTUs identified as enhanced in at least one bloom station compared with the reference Station R-2. Each of the OTUs is identified by a number and the most detailed phylogenetic assignment obtained. Blue-colored OTUs were not detected at the reference Station R-2, and red-colored OTUs were detected at station R-2. The different shades represent the relative abundance (Rel. Ab.) of the OTUs. White indicates absence of detection. The dashes indicate the OTU was detected in the sample but did not meet the criteria to be considered as enhanced (see Results and Discussion section). The stations are ordered according to a UPGMA clustering built from a weighted UNIFRAC distance matrix. The numbers at each node of the cluster indicate the percent of dissimilarity. Blue nodes correspond to a bootstrap support of 50% to 75% and red nodes correspond to a bootstrap support >75%. OTUs that were specifically associated to one of the two treatments in the continuous-culture experiment are noted with an asterisk (*). See Figure 3 and Results and Discussion section for details.

