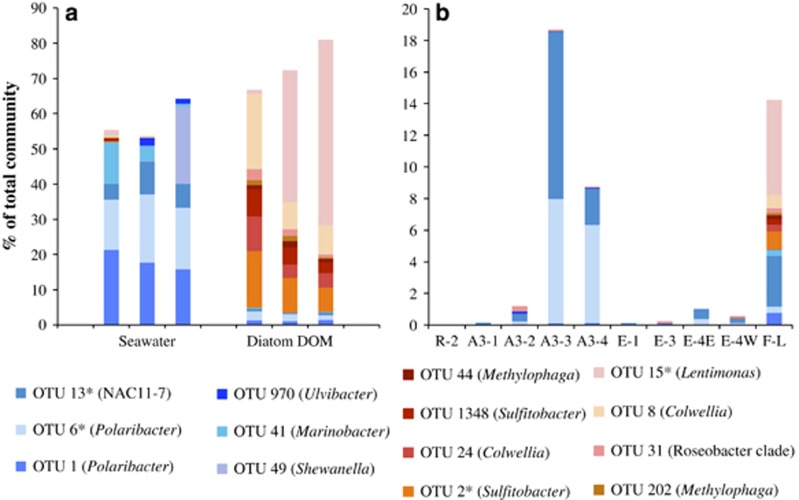
Figure 3.
Relative abundances of the OTUs associated to the seawater cultures (blue) and of the OTUs associated to the diatom-DOM cultures (red) in the continuous-culture experiment after four bacterial-generation times (a) and relative abundance in surface waters of the visited stations of the OTUs identified in the continuous-culture experiment (b). The relative abundances in individual triplicate cultures are shown. OTUs that were also detected enhanced at a bloom site are noted with an asterisk (*). See Figure 3 and Results and Discussion section for details.

