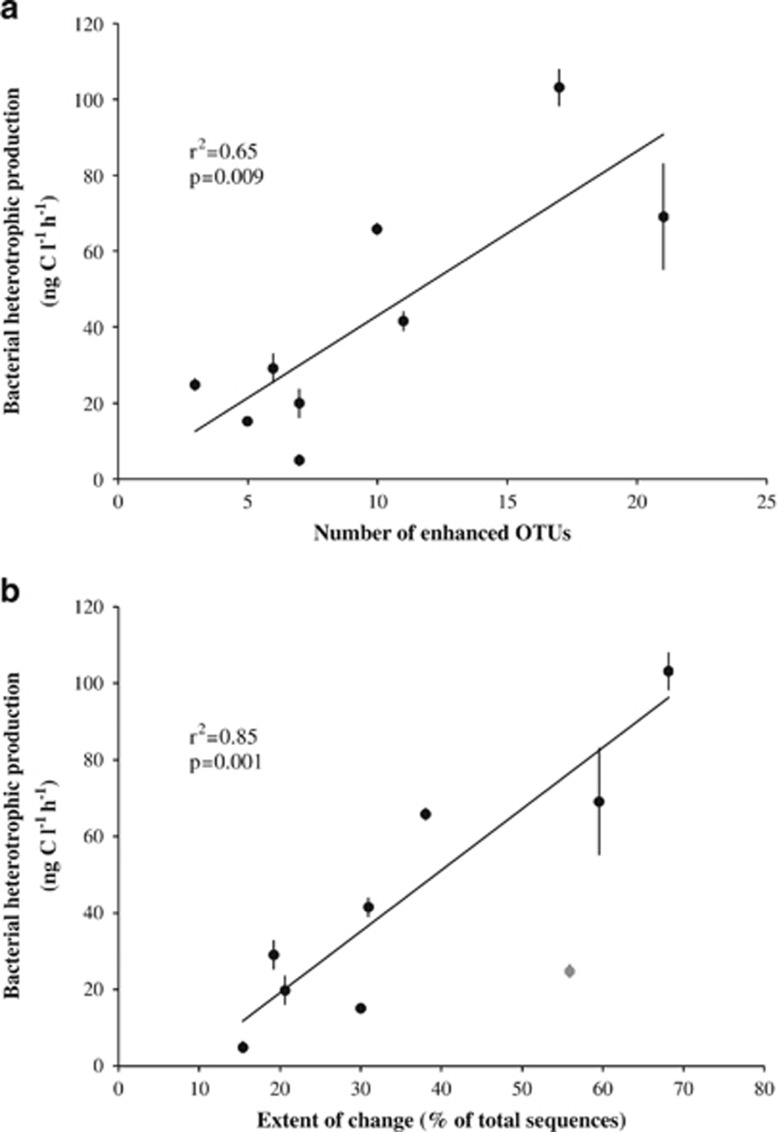
Figure 4.
Regression analysis between bacterial heterotrophic production (mean value±s.d. in the mixed layer) and the number of enhanced OTUs identified at each bloom site (a) and between bacterial heterotrophic production and the extent of change, determined as the sum of the relative abundances of the enhanced OTUs identified at each bloom site (b). For bacterial heterotrophic production, the mean value±s.d. in the mixed layer is given. The gray data point corresponds to station E-3, which was excluded for the calculation of P and r2 values.

