Figure 1.
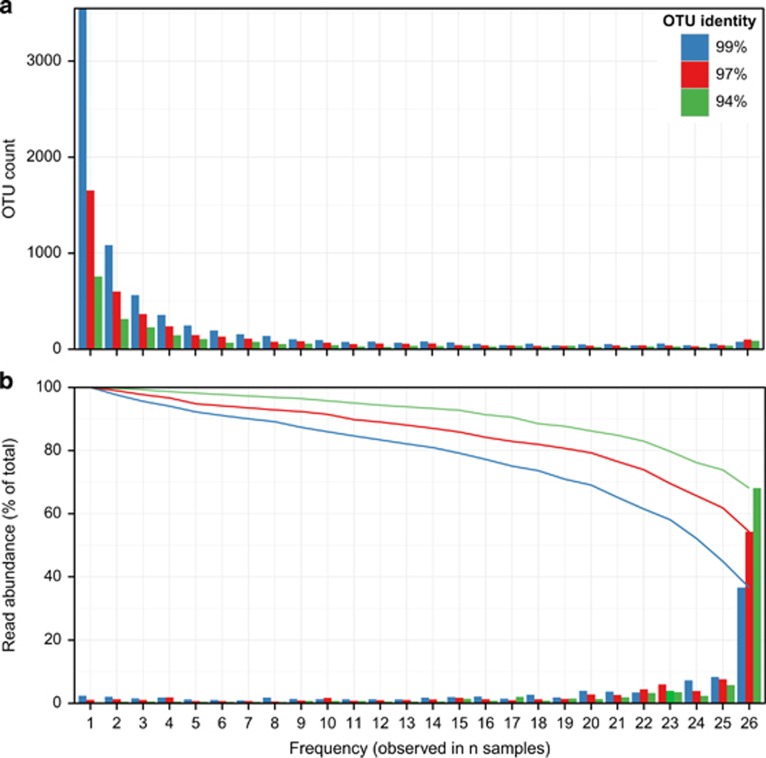
Frequency distribution of OTUs across samples. Core OTUs common to all 26 samples. Core and frequently observed OTUs made up a larger fraction of the total reads than transiently observed OTUs. The number of samples in which each OTU is observed against (a) the number of OTUs observed at each frequency and (b) the bars denote the relative read abundance of OTUs observed at each frequency and the lines present the cumulative total these frequencies from most- to least-frequently observed (lines). Colors denote OTUs clustered at genus-level (green, 94%), species-level (red, 97%), subspecies-level (blue, 99%).

