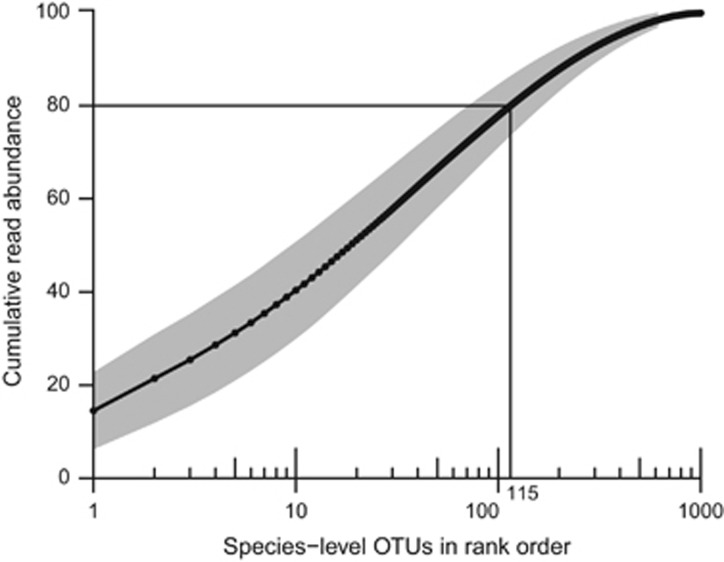
Figure 2.
Cumulative read abundance across 26 activated sludge samples. Cumulative read abundance (mean±SD) of species-level OTUs plotted in rank order for the 26 samples. In each sample, the 10 most abundant OTUs made up 40% (±10%) of the total reads on average and the 100 most abundant OTUs made up 78% (±6.8%). OTUs were considered abundant in a sample when they were among the OTUs making up the top 80% of reads.

