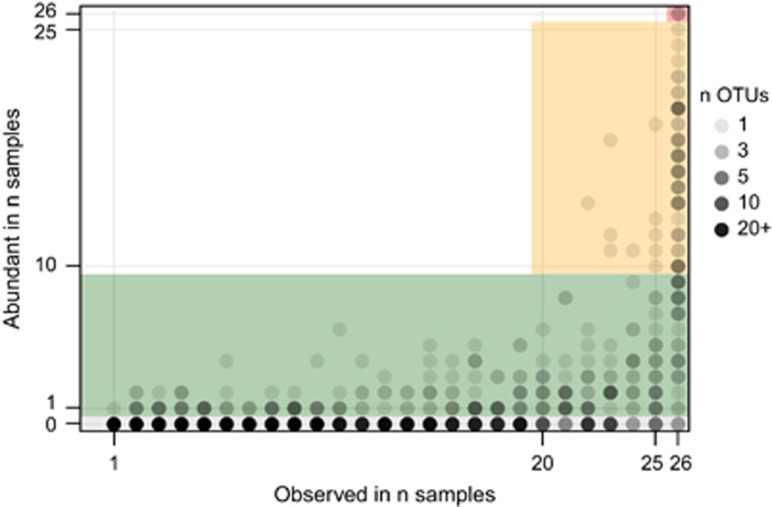
Figure 3.
Comparison of observation frequency and frequency of high abundance. Genus-level OTUs were plotted with slight transparency (alpha=0.2) such that darker points indicate more OTUs with those characteristics at that position. The OTUs were then classified as (a) Group 1: always abundant (26 samples, red), (b) Group 2: frequently abundant (⩾10 samples, yellow), (c) Group 3: transiently abundant in ⩾1 sample, green) and (d) Group 4: not abundant in any sample (gray). This was compared with the frequency at which the OTU was observed: transient (<20 samples), frequent (⩾20 samples) or core (26 samples).

