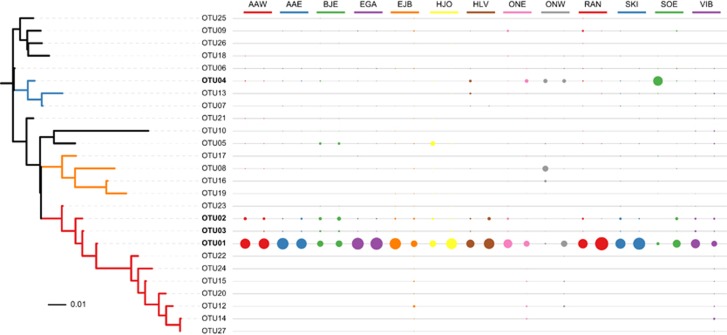
Figure 5.
Relative abundance of 99% OTUs Tetrasphaera across 13 plants. The relationship between the OTUs is presented as a maximum likelihood phylogenetic tree; the branches are colored to denote OTUs from Clade 1 (blue), Clade 2 (yellow) and Clade 3 (red). The size of the circles denotes the relative abundance of each OTU.

