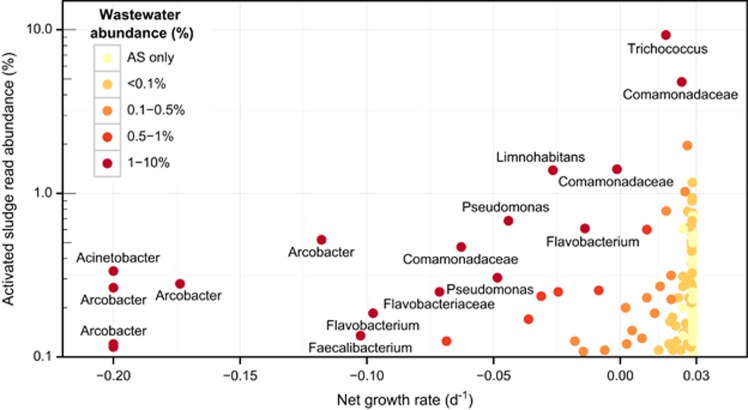
Figure 6.
Comparison of the read abundance in the activated sludge and the net growth rate for the Aalborg East plant. Points are colored by their abundance in the influent wastewater, and taxa >1% in the wastewater are named. Few abundant species-level OTUs had a low net growth rate, indicating that their abundance was due to contribution from the influent bacteria.

